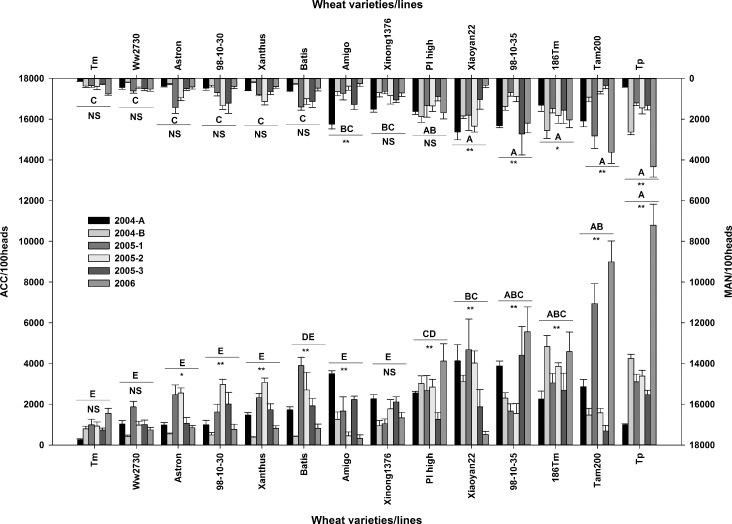
Fig 5.
The maximum aphid number (MAN, or aphid peak number, top x axes and right y axes) and the aphid cumulative count (ACC, below x axes and left y axes)for the 14 wheat varieties on 6 fields/sections over 3 years. Different capital letters above the horizontal lines indicate the significance of differences of the average of the 6 fields/sections across the 14 wheat varieties/lines. Strongly significant (p < 0.01) values are marked as ‘**,’ significant (0.05 < p < 0.01) values are marked as ‘*,’ and non-significant (p > 0.05) values are marked as ‘NS,’ and are shown below the horizontal lines.

