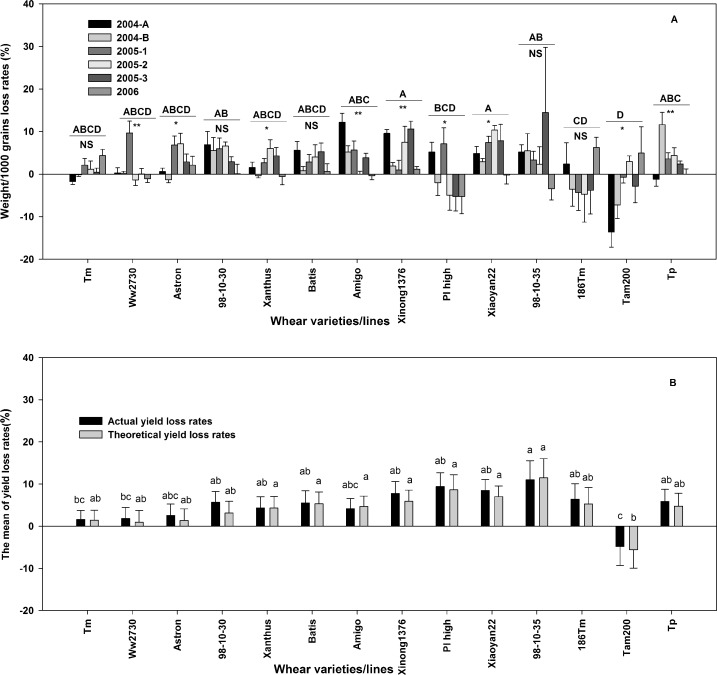
Fig 6.
The loss rates of the 1000 grain weight (KW), for the 14 wheat varieties on 6 fields/sections over 3 years (A), and the loss rates average of theoretical yield (TY) and actual yield (AY) for the 14 wheat varieties based 6 fields/sections over 3 years. In part A, different capital letters above the horizontal lines indicate the significance of differences of the averages of the 6 fields/sections across the 14 wheat varieties/lines. Strongly significant (p < 0.01) values are marked as ‘**,’ significant (0.05 < p < 0.01) differences are marked as ‘*,’ and non-significant (p > 0.05) differences are marked as ‘NS,’ and are shown below the horizontal lines. In part B, different little letters above the bar indicate the significance of the differences for the averages of the varieties/lines (p < 0.05).

