Figure 2.

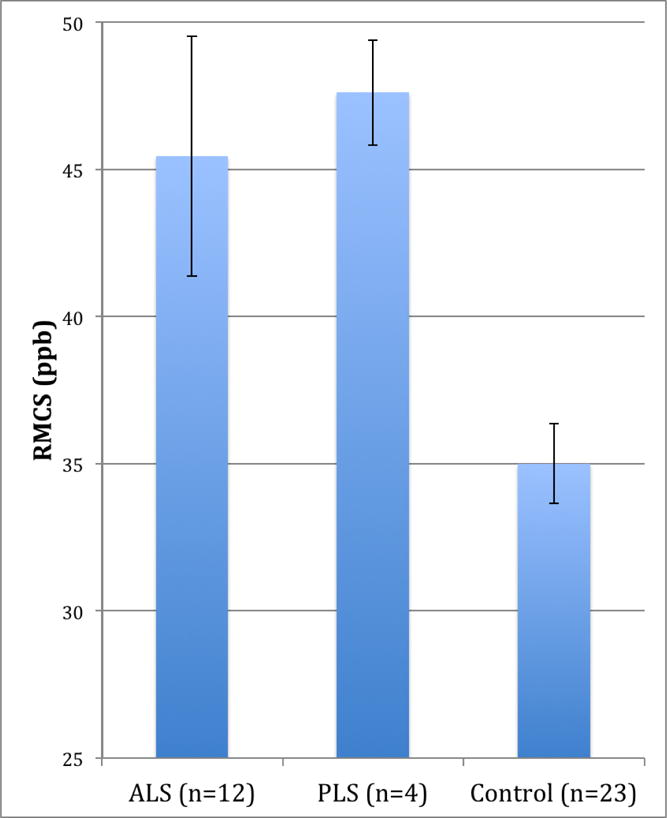
Relative motor cortex susceptibility by diagnosis stratified into ALS, PLS, and control groups, with bars indicating standard error for each group. Note: RMCS, relative motor cortex susceptibility.

Relative motor cortex susceptibility by diagnosis stratified into ALS, PLS, and control groups, with bars indicating standard error for each group. Note: RMCS, relative motor cortex susceptibility.