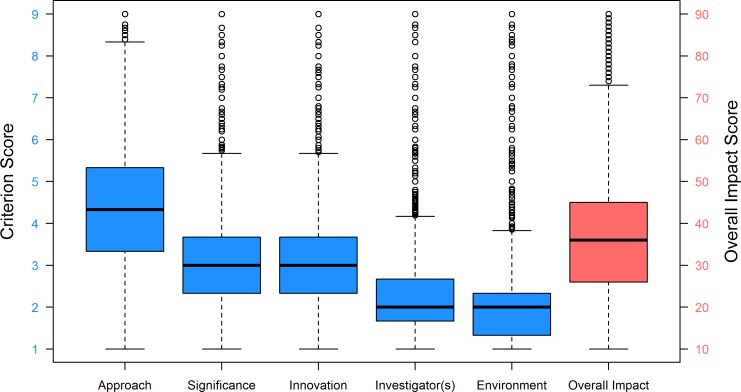
Fig 1. Box Plot Distributions of Criterion and Overall Impact Scores for R01 Applications, FY 2010–2013.
Fig 1 shows the box plot distributions of the five research criterion scores (scale: 1–9) and the Overall Impact score (scale: 10–90). Box plot whiskers extend to the most extreme data point which is no more than 1.5 times the interquartile range from the box. Each criterion score N = 123,707 applications; Overall Impact score N = 71,651 applications.

