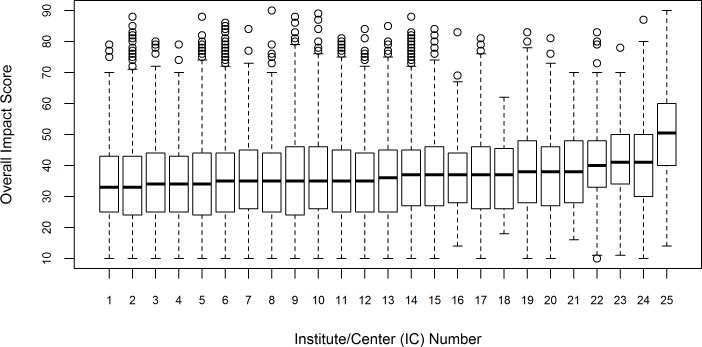
Fig 2. Box Plot Distributions of Overall Impact Scores for R01 Applications by IC, FY 2010–2013.
Fig 2 shows the box plot distributions of the Overall Impact score (scale: 10–90) by IC. Box plot whiskers extend to the most extreme data point which is no more than 1.5 times the interquartile range from the box. IC names have been masked. N = 71,651 applications (discussed applications only).

