
Figure 2.
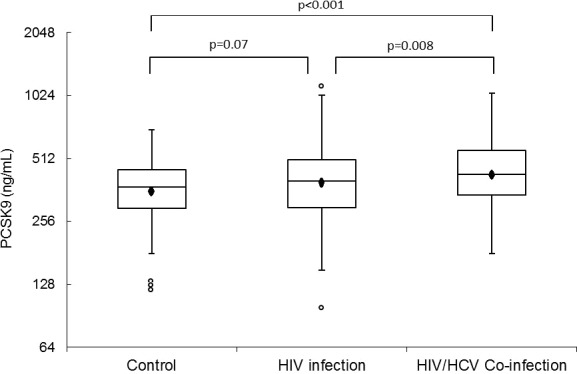
PCSK9 levels in uninfected controls, HIV‐infected, and HIV/HCV‐coinfected individuals. The boxes represent IQR, the outer bars represent the 1.5 IQR below 25th percentile and 1.5 IQR above 75th percentile. The circles beyond the outer bars represent extreme values. The marker inside the box indicates the mean value. The line inside the box indicates the median value. Compared with controls, HIV/HCV‐coinfected individuals had 21% higher PCSK9 levels while HIV‐infected individuals had 9% higher PCSK9 levels (P=0.07). When compared with HIV‐infected subjects, HIV/HCV‐coinfected individuals had 11% higher PCSK9 levels (P=0.008). PCSK9 indicates proprotein convertase subtilisin kexin 9; HCV, hepatitis C virus.