
Figure 7.
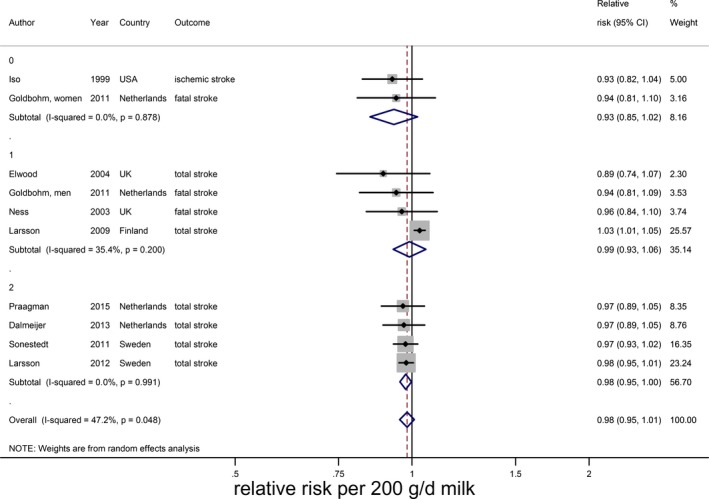
Relative risks of total stroke for an increment of 200 g/day in milk intake in Western countries, stratified for sex. Squares represent study‐specific relative risk estimates (size of the square reflects the study‐specific statistical weight, ie, the inverse of the variance); horizontal lines represent 95% CIs; diamonds represent summary relative risk estimates with 95% CIs (0=women, 1=men, 2=mixed).