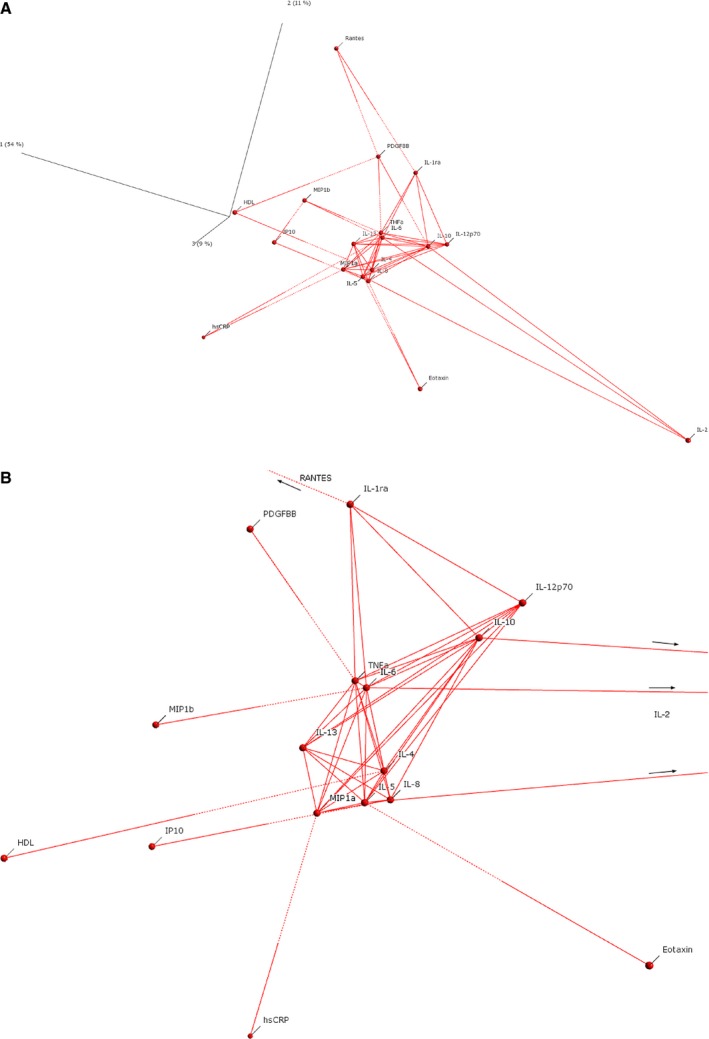
Figure 2.

Variable principal component plots of plasma biomarkers. A, Log‐transformed AAA‐associated markers (P<0.05), with each linked to its nearest two neighbors. Solid lines (Euclidean distance threshold >65%) indicate those markers with a stronger degree of relatedness. Notice that the AAA‐associated markers, which showed independent association in multiple logistic regression (eotaxin, hsCRP, RANTES, and HDL), were more‐peripheral members of the network with a lesser degree of relatedness (dotted connection lines) to the central hub of the network. B, Central hub of the network shown in (A), with each linked to its nearest neighbor or displaying a stronger degree of relatedness (Euclidean distance threshold >65%). Notice that markers such as IL‐6, TNF‐α, IL‐10, IL‐8, IL‐4, Il‐5, IL‐12p70, MIP‐1a, and IL‐1RA were central members of the network. AAA indicates abdominal aortic aneurysm; HDL, high‐density lipoprotein; hsCRP, high sensitivity C‐reactive protein; IL, interleukin; MIP‐1a, macrophage inflammatory protein 1 alpha; RANTES, regulated on activation, normal T‐cell expressed and secreted; TNF‐α, tumor necrosis factor alpha.
