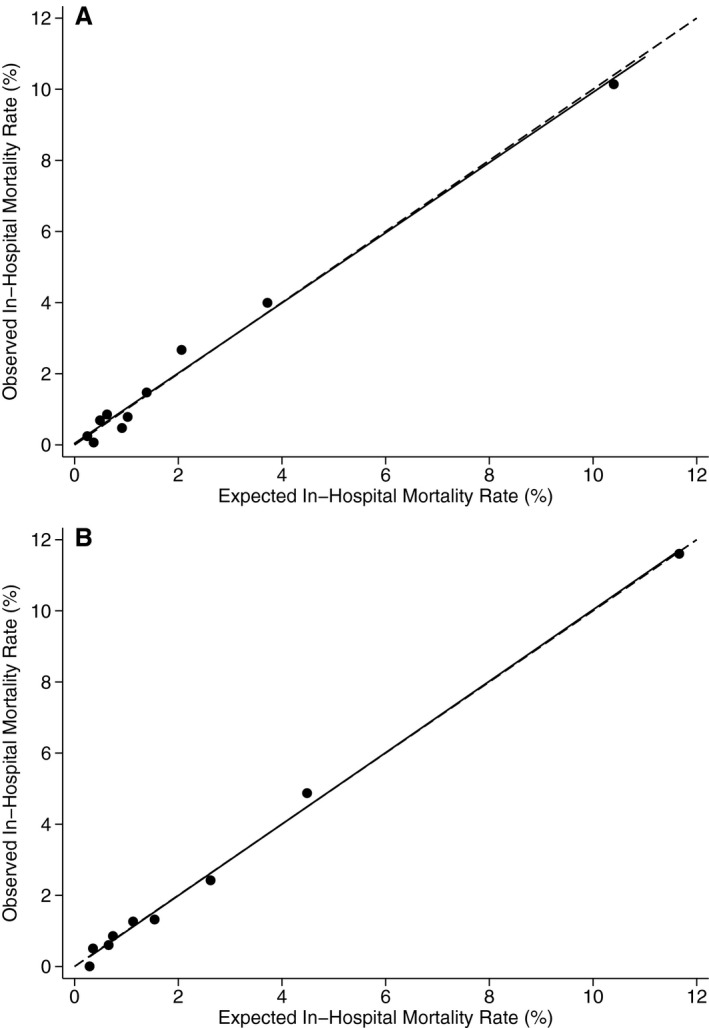
Figure 2.

A, Calibration of the Agency for Healthcare Research and Quality (AHRQ) Pediatric Quality Indicator (PDI) 06 model based on Hosmer–Lemeshow goodness‐of‐fit test (Healthcare Cost and Utilization Project [HCUP] State Inpatient Databases [SID] 2013). B, Calibration of Risk Adjustment for Congenital Heart Surgery (RACHS‐1) model based on Hosmer–Lemeshow goodness‐of‐fit test (HCUP SID 2013). Circles represent observed and expected mortality rates within each decile of risk. The solid line represents the linear regression of observed in‐hospital mortality rate vs expected in‐hospital mortality rate. The dashed line represents the situation where observed and expected rates are identical. Source: AHRQ.24, 25
