
Figure 4.
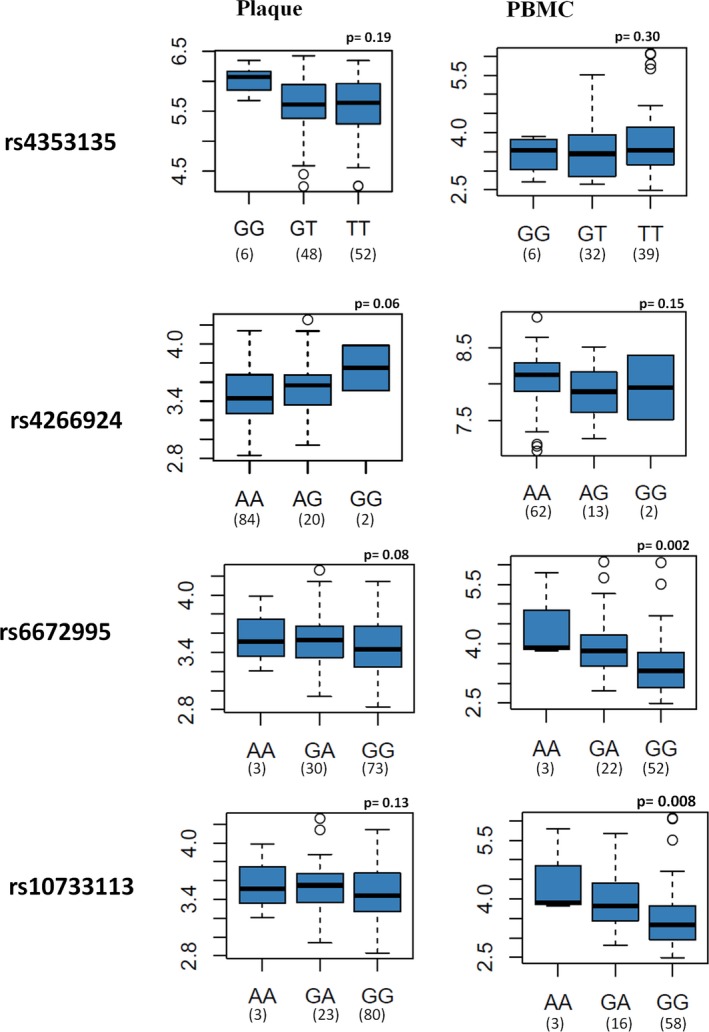
Association between genotype of variants and expression level of the NLR family, pyrin domain containing 3 (NLRP3) gene in plaque and peripheral blood mononuclear cells (PBMCs). The Y axis represents −log10 (P), calculated using additive model for the association between genotype and expression level. The X axis represents different genotypes of the variants. The minimum and maximum values are represented by whiskers, the first and third quartiles (box), the median values (medlines), outliers are displayed as circles. The Y axis represents the mRNA expression level of NLRP3.