
Figure 5.
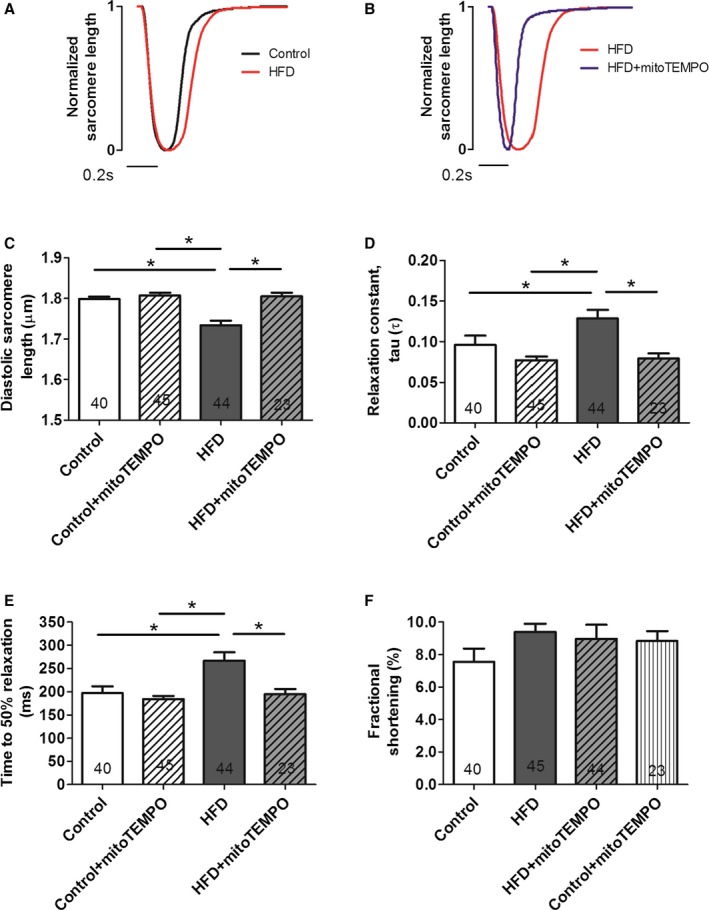
MitoTEMPO effects on relaxation in isolated cardiomyocytes. A and B, Representative normalized sarcomere contraction and relaxation traces in control (black) vs HFD mice (red) (A); HFD mice vs mitoTEMPO‐treated mice (blue) (B). Bar represents 0.2 seconds. C, Basal diastolic sarcomere length. D, Relaxation constant, τ. E, time to 50% relaxation. F, Fractional shortening. N=4 mice in control, N=6 mice in the HFD and mitoTEMPO groups. Five to 10 myocytes were studied from each mouse. Total cardiomyocytes are indicated in each bar graph. *P<0.05. HFD indicates high‐fat diet; MitoTEMPO, 2‐(2,2,6,6‐tetramethyl‐piperidin‐1‐oxyl‐4‐ylamino)‐2‐oxoethyl‐triphenylphosphonium chloride).