
Figure 10.
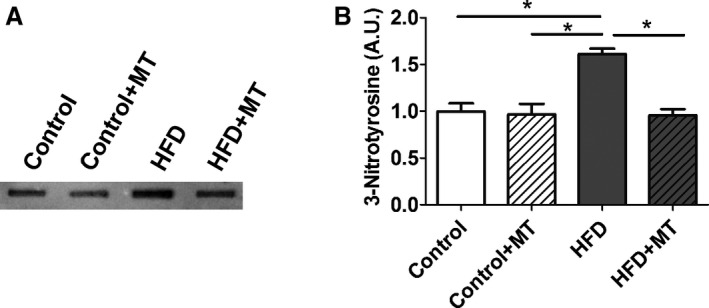
3‐Nitrotyrosine (3‐NT) level in HFD heart. A, Slot blots were performed using a 3‐ NT antibody. B, Representative densitometry analysis. Data represent mean±SEM. *P<0.05. N=6 in each group. HFD indicates high‐fat diet; MT, mitoTEMPO.
Official websites use .gov
A
.gov website belongs to an official
government organization in the United States.
Secure .gov websites use HTTPS
A lock (
) or https:// means you've safely
connected to the .gov website. Share sensitive
information only on official, secure websites.
3‐Nitrotyrosine (3‐NT) level in HFD heart. A, Slot blots were performed using a 3‐ NT antibody. B, Representative densitometry analysis. Data represent mean±SEM. *P<0.05. N=6 in each group. HFD indicates high‐fat diet; MT, mitoTEMPO.