
Figure 11.
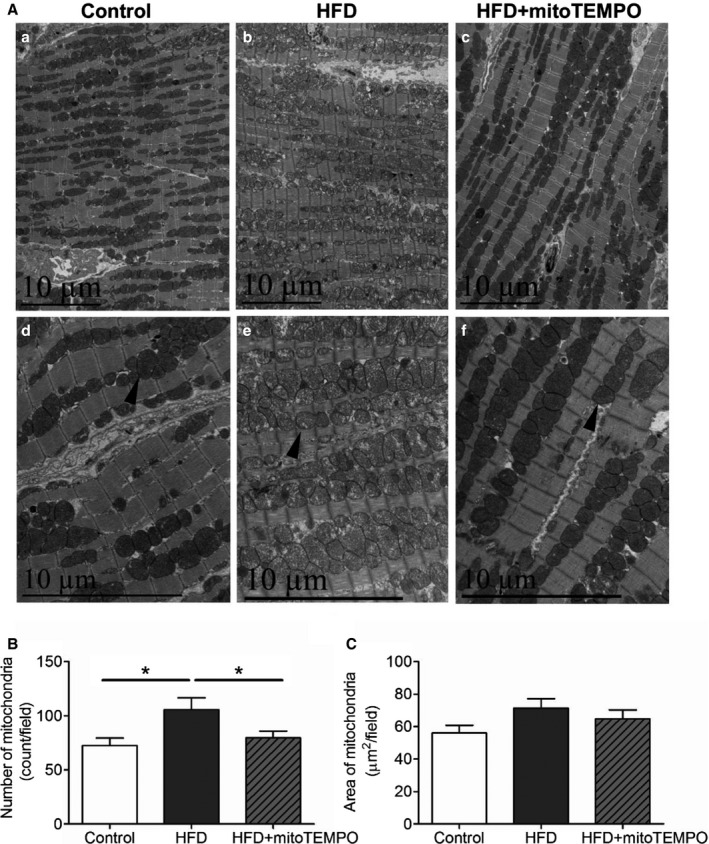
Electron microscopy of mitochondrial morphology with HFD. A, Transmission electron micrographs of hearts from control, HFD mice, and HFD mice treated with mitoTEMPO. a and d, control; b and e, HFD; c and f, mitoTEMPO‐treated HFD mice. a, b, and c, ×5780. d, e, and f, ×11 600 magnification. Arrowhead indicates typical mitochondria in each group. Bar indicates 10 μm. B, Averaged numbers of mitochondria in each field. C, Quantification of total mitochondrial areas in each field. N=3 to 5 in each group. *P<0.05. HFD indicates high‐fat diet; MitoTEMPO, 2‐(2,2,6,6‐tetramethyl‐piperidin‐1‐oxyl‐4‐ylamino)‐2‐oxoethyl‐triphenylphosphonium chloride).