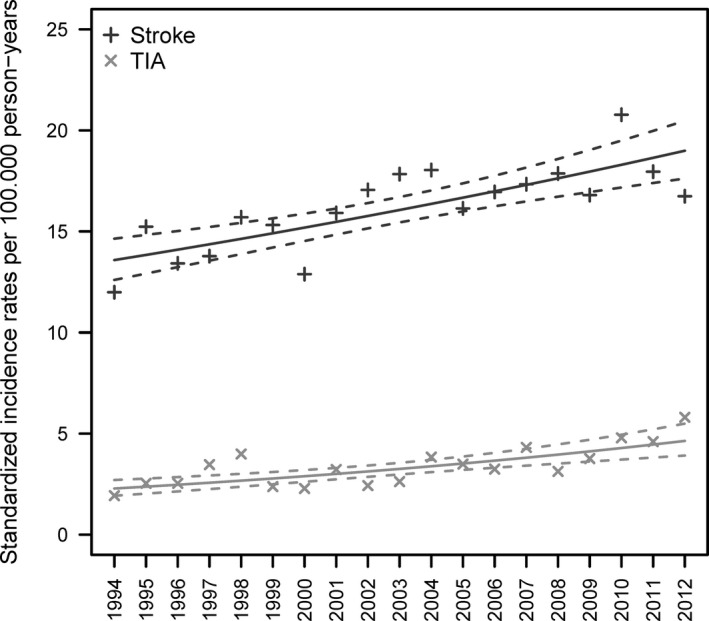
Figure 1.

Age‐standardized incidence rates per 100 000 person‐years for hospitalizations for overall stroke (ie, all subtypes combined) and transient ischemic attack (TIA) separately. Points are the age‐standardized incidence rates, whereas the solid lines are the estimated trends of the standardized incidence rates and the dashed lines represent the corresponding 95% CIs.
