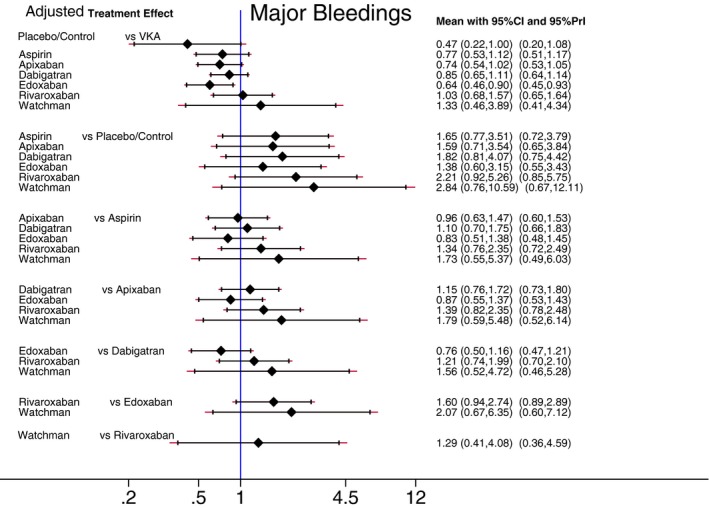
Figure 7.

Reduction of major bleeding. Unadjusted predictive interval plot for the primary safety outcome major bleedings, on a logarithmic scale. Solid black lines represent the confidence intervals (CI) for summary odds ratios for each comparison and the red dashed lines the respective PrI. The blue line is the line of no effect (odds ratio equal to 1). PrI indicates predictive intervals; VKA, vitamin K antagonists.
