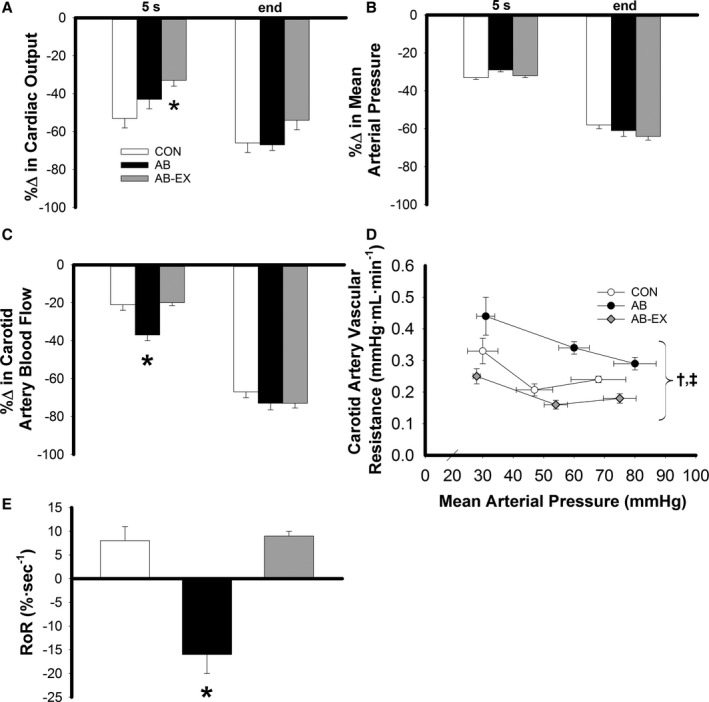
Figure 4.

Percentage changes in (A) cardiac output, (B) mean arterial pressure, and (C) carotid artery blood flow; (D) changes in carotid artery vascular resistance († P<0.05, group main effect, AB vs all other groups, ‡ P<0.05, group main effect, CON vs AB‐EX); and (E) RoR at 5 seconds and the end of vena cava occlusion. *P<0.05 vs all other groups. AB indicates the aortic‐banded sedentary group; AB‐EX, aortic‐banded exercise‐trained group; CON, nonsham sedentary control group; RoR, rate of regulation.
