
Figure 5.
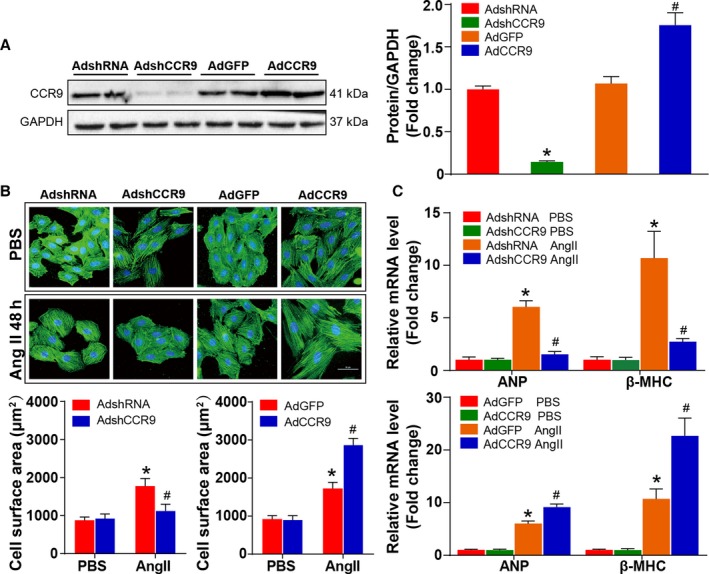
CCR9 modulates Ang II–induced cardiomyocyte hypertrophy in vitro. A, Western blot analysis and quantification results for CCR9 expression level in each group (*P<0.05 vs AdshRNA group; # P<0.05 vs AdGFP group). B, Representative images of NRCMs infected with AdshCCR9 or AdCCR9 and treated with Ang II (1 μmol/L) or PBS for 48 hours (blue: nuclear; green: α‐actin; scale bar=50 μm; n=6 per group). Cell surface area is assessed and compared in AdshCCR9 and AdCCR9 groups (n=12 per group; at least 55 cells were examined each group; *P<0.05 vs AdshRNA or AdGFP/PBS group; # P<0.05 vs AdshRNA or AdGFP/Ang II group). C, The relative levels of hypertrophic markers mRNAs in NRCMs infected with AdshCCR9 and AdCCR9 (n=12 per group; *P<0.05 vs AdshRNA or AdGFP/PBS group; # P<0.05 vs AdshRNA or AdGFP/Ang II group). AdGFP indicates Adenoviral green fluorescent protein; AdshRNA, Adenoviral short hairpin RNA; Ang II, angiotensin II; ANP, atrial natriuretic peptide; β‐MHC, β‐myosin heavy chain; CCR9, C‐C motif chemokine receptor 9; NRCM, neonatal rat cardiomyocyte.