
Figure 7.
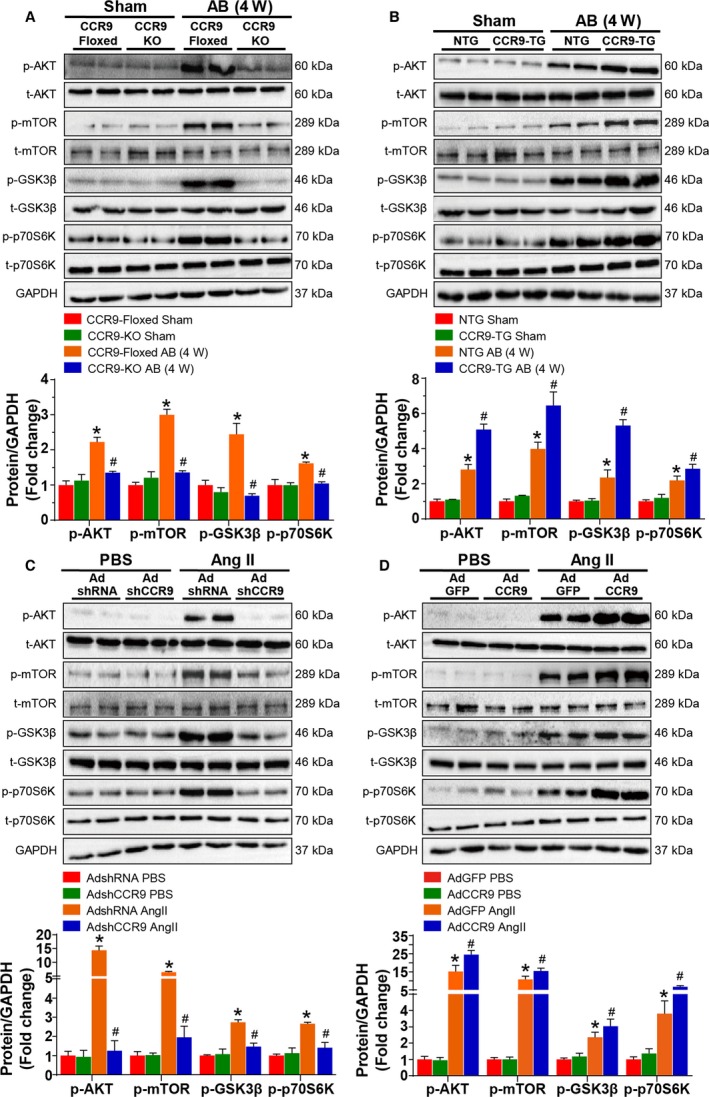
AKT signaling acts downstream of CCR9. A and B, Representative results for Western blot, and quantification results of the phosphorylation of AKT, m‐TOR, GSK3β, and p70S6K and their basal volumes in the indicated groups (n=6 per group; *P<0.05 vs CCR9‐floxed or NTG/sham group; # P<0.05 vs CCR9‐floxed or NTG/AB group). C and D, Representative results for Western blot, and quantification results of the phosphorylation of AKT, m‐TOR, GSK3β, and p70S6K and their basal volumes in the indicated groups (n=6 per group; *P<0.05 vs AdshRNA or AdGFP/PBS group; # P<0.05 vs AdshRNA or AdGFP/Ang II group). AB indicates aortic banding; Ang II, angiotensin II; CCR9, C‐C motif chemokine receptor 9; GSK3β, glycogen synthase kinase 3β; KO, knockout; mTOR, mammalian target of rapamycin; NTG, nontransgenic; TG, transgenic; W, weeks.