
Figure 2.
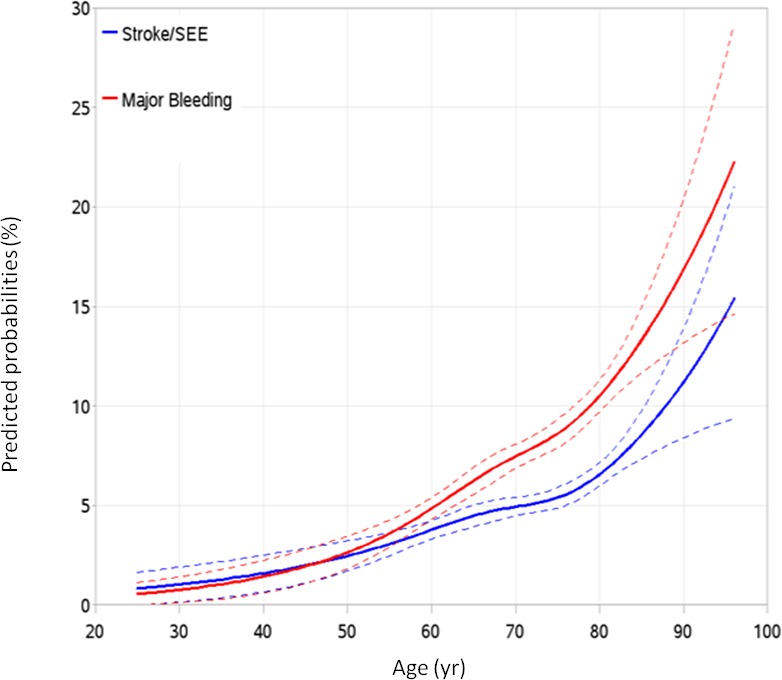
Calculated probabilities by continuous age. The outcomes were analyzed by age as a continuous variable for stroke or SEE (blue line) and major bleeding (red line). The dotted lines represent the 95% CI. SEE indicates systemic embolic event.