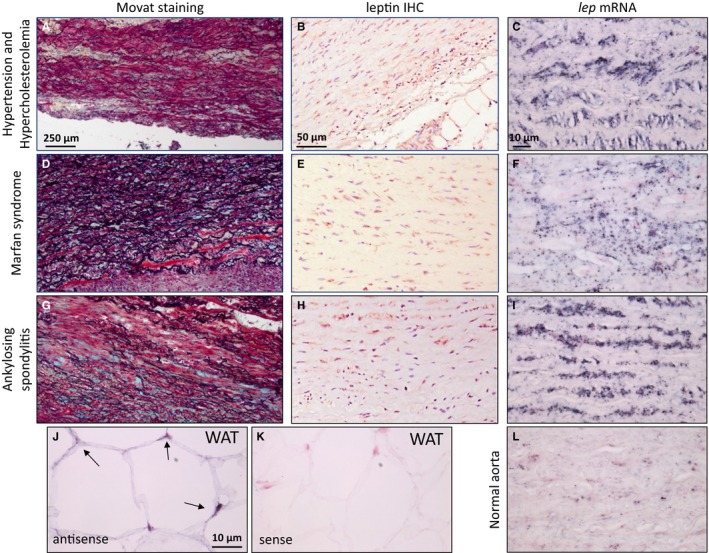
Figure 1.

Analysis of surgical ATAA samples collected from patients with a variety of diseases underlying ATAA. A through C, Hypertension and hypercholesterolemia. D through F, Marfan syndrome. G through I, Ankylosing spondylitis. A, D, and G, Diffuse elastic fiber fragmentation with glycosaminoglycan deposition (bluish‐green), matrix clearing, and media degeneration, Movat's pentachrome. Scale bar=250 μm. B, E, and H, Leptin immunostaining in medial smooth muscle cells. Scale bar=50 μm. C, F, I, and L, The lep mRNA (black staining) is present in diseased aortas but is scarcely present in normal aorta. Scale bar=10 μm. J and K, Positive (antisense) (J) and negative (sense) (K) control for lep mRNA. In situ hybridization in human WAT. Scale bar=10 μm. ATAA indicates ascending thoracic aortic aneurysm; IHC, immunohistochemistry; WAT, white adipose tissue.
