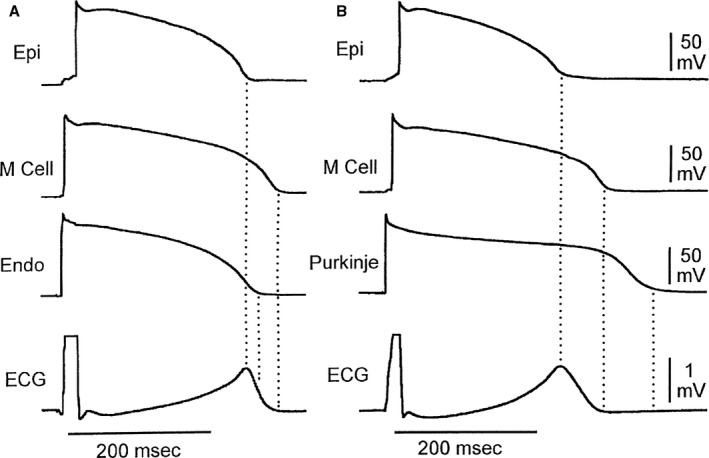
Figure 2.

Cellular basis for normal T‐wave inscription. Shown here is the temporal relationship between transmembrane action potentials recorded from epicardial, M region, and endocardial (A) or subendocardial Purkinje fiber regions (B). Note that M cell repolarization is aligned with end of the T wave, whereas repolarization of the epicardial cells is coincident with the peak of the T wave. ECG indicates electrocardiogram; Endo, endocardial; Epi, epicardial; M Cell, Masonic myocardial Moe cell. Reproduced with permission from Yan et al.10 Promotional and commercial use of the material in print, digital, or mobile device format is prohibited without the permission from the publisher Wolters Kluwer Health.
