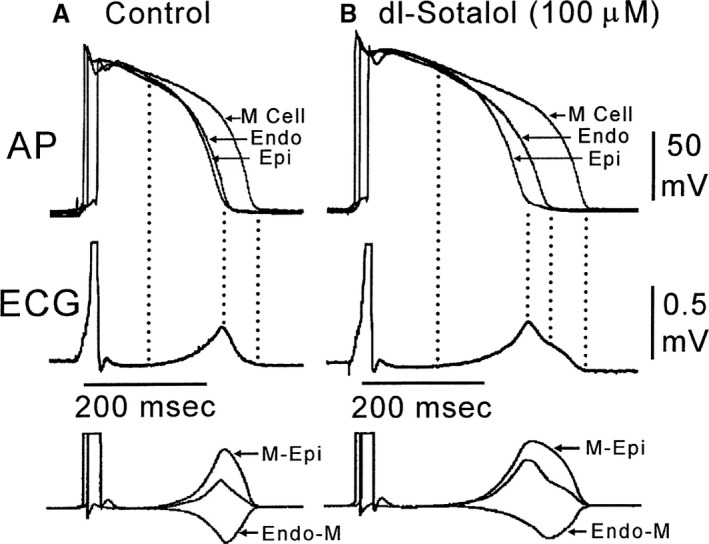
Figure 3.

Transmural dispersion of repolarization. Shown here are the baseline (A) and sotalol‐induced changes (B) in APD of each layer of the canine left ventricular arterially perfused wedge. Note the disproportionately prolonged M‐cell action potential and its corresponding contribution to the prolongation of the time from the peak to the end of the T wave (Tpeak−end). Note as well the bifurcated or notched T‐wave morphology. The bottom of the figure shows the calculated voltage differences between epicardial and M‐cell APs (M‐Epi) and between the M‐cell and endocardial responses (Endo‐M) (bottom). AP indicates action potential; APD, action potential duration; ECG, electrocardiogram; Endo, endocardial; Epi, epicardial; M Cell, Masonic myocardial Moe cell. Reproduced with permission from Yan et al.10 Promotional and commercial use of the material in print, digital, or mobile device format is prohibited without the permission from the publisher Wolters Kluwer Health.
