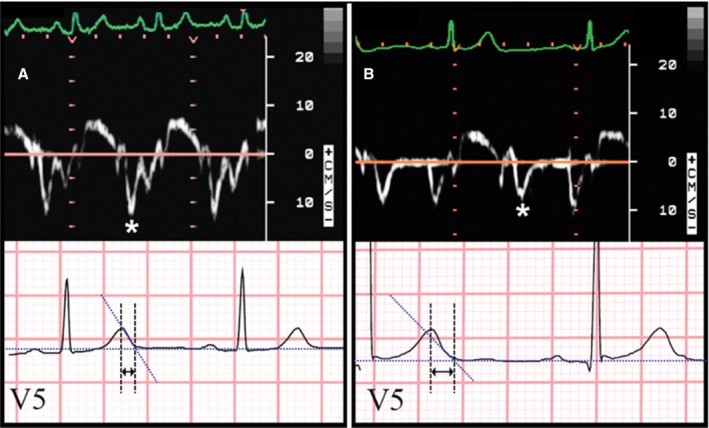
Figure 5.

Correlation between tissue Doppler and ECG markers of repolarization heterogeneity. Shown here is an example of the relationship between tissue Doppler e′ velocity and ECG TpTe interval. A, Normal e′ velocity (12.1 cm/s) and short TpTe interval (65 ms). B, Abnormally reduced e′ velocity (7.8 cm/s) and long TpTe interval (115 ms). Asterisks denote e′ wave on tissue Doppler tracings. Arrows denote TpTe interval on ECG tracings. Reproduced from Sauer et al.65 Promotional and commercial use of the material in print, digital, or mobile device format is prohibited without the permission from the publisher Wolters Kluwer Health. ECG indicates electrocardiogram.
