
Figure 3. Mitochondrial stress induced chromatin reorganization.
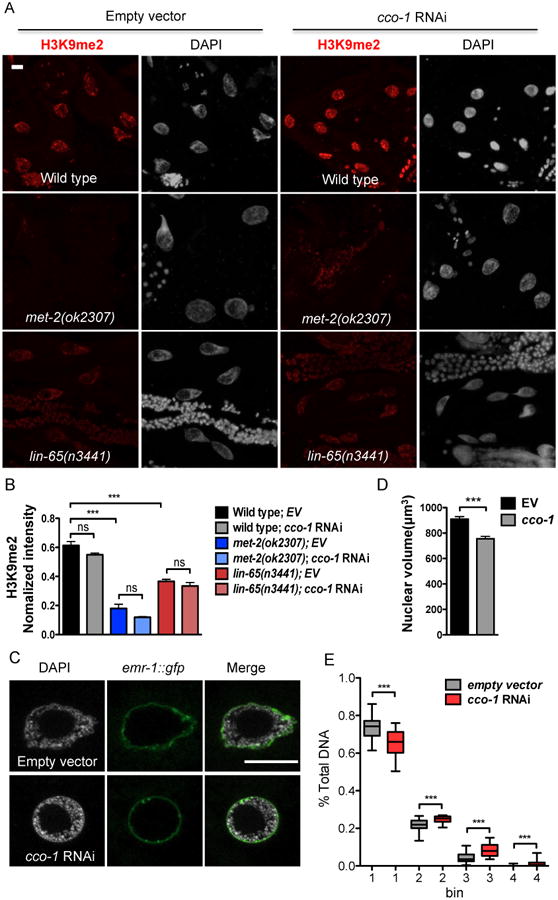
(A) Representative maximal intensity projection images of H3K9me2 immunostaining of intestinal nuclei in Day 1 adult WT, met-2 or lin-65 mutant animals grown on EV or cco-1 RNAi from hatch (as indicated). H3K9me2 (Red); DAPI (Grey). Scale bar represents 10 μm.
(B) Quantification of H3K9me2 level. The genotypes and treatments are as in (A). H3K9me2 intensity is normalized to DAPI intensity. (*** denotes p < 0.0001; ns denotes p > 0.05 via t-test, error bars indicate SEM, n ≥ 15 nuclei)
(C) Representative of 3 center images of DAPI staining with lmn-1p∷emr-1∷gfp of intestinal nuclei in Day 1 adult animals grown on EV or cco-1 RNAi from hatch as indicated. lmn-1p∷emr-1∷gfp (Green); DAPI (Grey). Scale bar represents 10 μm.
(D) Quantification of the intestinal nuclear size at Day 1 adulthood using lmn-1p∷emr-1∷gfp as a marker. Animals grown on EV or cco-1 RNAi from hatch (*** denotes p < 0.0001 via t-test, error bars indicate SEM, n ≥ 20 nuclei)
(E) Quantification of the distribution of DAPI staining signal in intestinal nuclei at Day 1 of adulthood in animals grown on EV or cco-1 RNAi from hatch. The distribution of fractions from the top four bins are shown as boxplots. (*** denotes p < 0.0001 via mann-whitney test, error barsindicate SEM, n ≥ 25 nuclei)