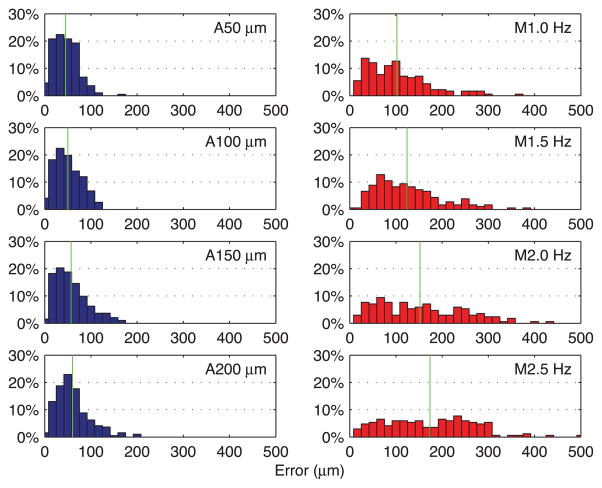
Fig. 6.
Normalized histograms of error for automated and manual trials. The left column shows the normalized histograms of error obtained in the automated trials. The right column shows the normalized histograms of error for the manual trials. A green vertical line indicates the mean of each distribution.

