Figure 3.

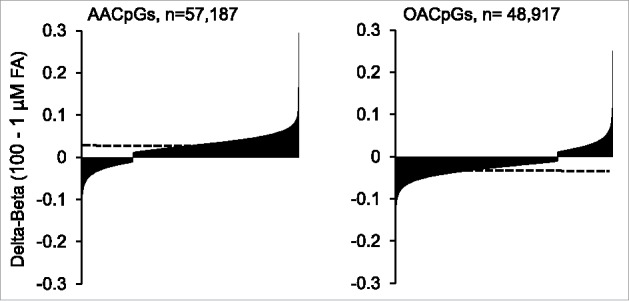
- Distribution of hypermethylated and hypomethylated AACpGs and OACpGs. The AACpG and OACpG sets are ordered for increased Δβ between the 2 extreme FA doses. The horizontal dashed lines indicate the overall average Δβ for each CpG set.

- Distribution of hypermethylated and hypomethylated AACpGs and OACpGs. The AACpG and OACpG sets are ordered for increased Δβ between the 2 extreme FA doses. The horizontal dashed lines indicate the overall average Δβ for each CpG set.