
Figure 5.
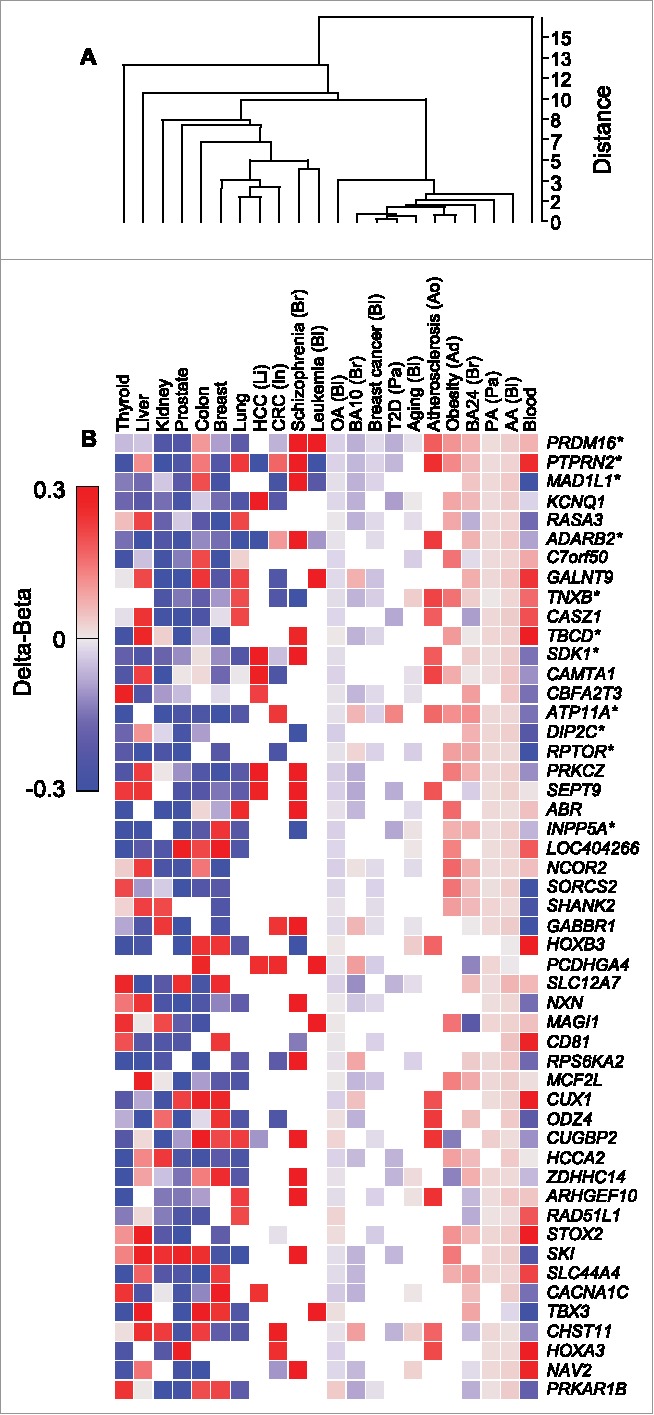
Clustering analysis of CpGs that are common to AACpG or OACpG or both, and to the indicated disease and normal tissue DNA methylation profiles. A, Overall data clustering. B, Top 50 genes ranked by the number of harbored CpGs included in the clustering analysis. Asterisks indicate the top 11 genes ranked by the number of AACpG/gene. Red and blue, hypermethylation and hypomethylation, respectively. The tissue origin or relation is indicated for non-normal tissue samples as follows: Ad, adipose tissue; Ao, aorta; Bl, blood; Br, brain; In, intestine; Li, liver; Pa, pancreas.