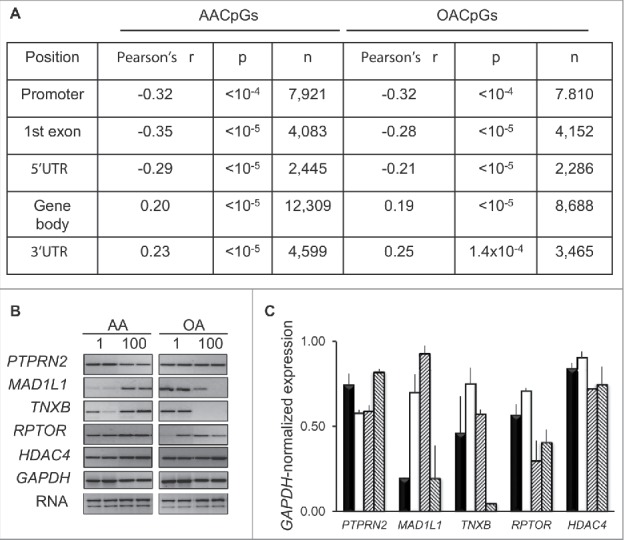
Figure 6.

Effects of dose-dependent changes in DNA methylation on gene expression. A, Correlation between 100–1 μM AA or OA Δβ and expression array-based corresponding expression levels. B, RT-PCR analysis of selected genes following AA and AO stimulation of THP-1 cells for 24 h at 1 and 100 μM concentration. C, GAPDH RNA-normalized expression. The bars for each gene indicate, left to right: 1 μM AA, 100 μM AA, 1 μM OA, 100 μM OA, respectively.
