Figure 4.

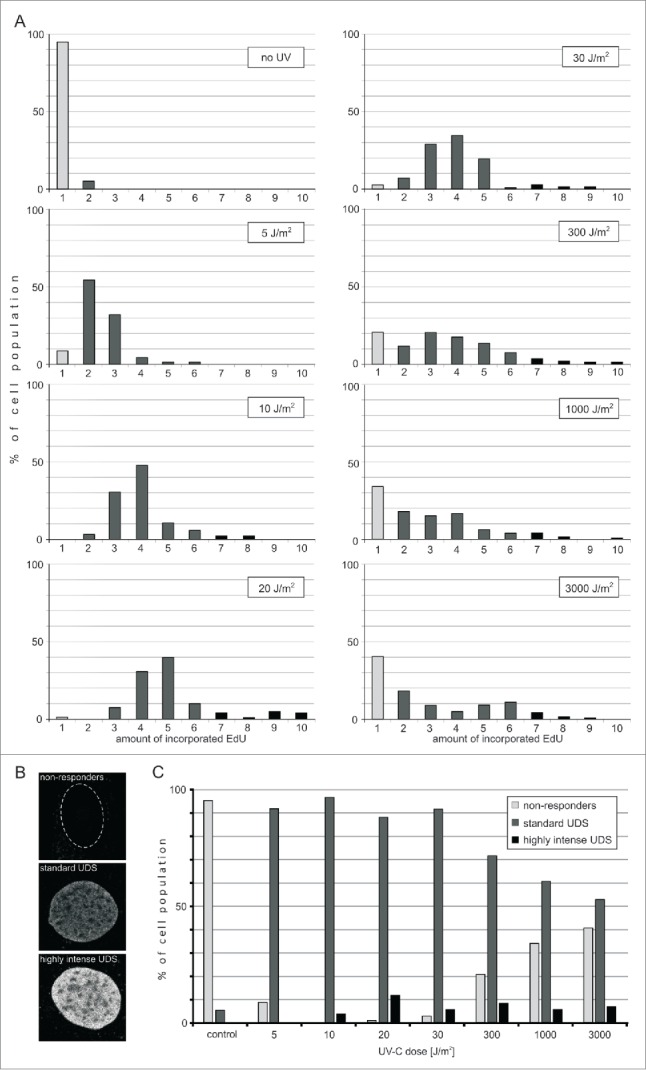
Efficiency of UDS in fibroblasts following exposure to UVC. (A) Incorporation of EdU during UDS. Histograms representing distribution of the amounts of EdU incorporated during repair in cells exposed to various doses of UVC. Gray bars represent cells that do not exhibit detectable EdU signals. Black bars represent cells that incorporate various amounts of EdU during repair. The number of cells measured in each sample was 58 to 160. (B) Three images representing the nuclei of cells with different UDS efficiencies. A cell that did not incorporate any EdU (top image; the contour of this nucleus is shown), and cells that incorporated medium (middle), and high amounts of EdU (bottom image) during repair of UVC-induced damage. Scale bar 5 μm. (C) Proportions of cells that do not respond to UVC damage, or respond by incorporating medium or high amounts of EdU, as a function of the UVC dose delivered. The percentage of 'non-responders' decreases for doses between 5 and 10 J/m2, and increases again with higher doses of UVC (20 – 3,000 J/m2), while the proportion of cells showing a standard response decreases. The proportion of cells with very efficient UDS is independent of the UVC dose.
