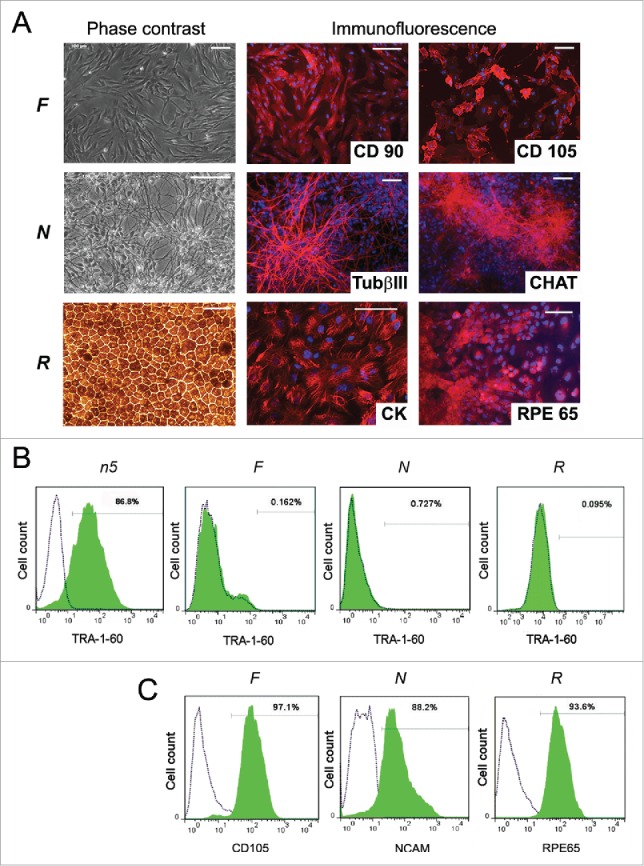
Figure 2.

Characterization of n5 somatic derivatives. (A) Morphology (phase contrast microscopy) and immunocytochemistry of fibroblast-like cells (F), neurons (N), and retinal pigment epithelial cells (R). TUBb3, β-tubulin (III); CHAT, choline acetyltransferase; CK, cytokeratin; RPE65, retinal pigment epithelium-specific 65 kDa protein. Signals corresponding to the respective markers are shown in red, with blue indicating nuclei stained with DAPI. Scale bar, 100 mM. (B) FACS analysis of TRA-1-60 expression in differentiated cells. Dotted lines represent isotype controls and antibody staining is shown in green. (C) FACS analysis of the purity of magnetically separated F, N, and R cells for corresponding somatic markers.
