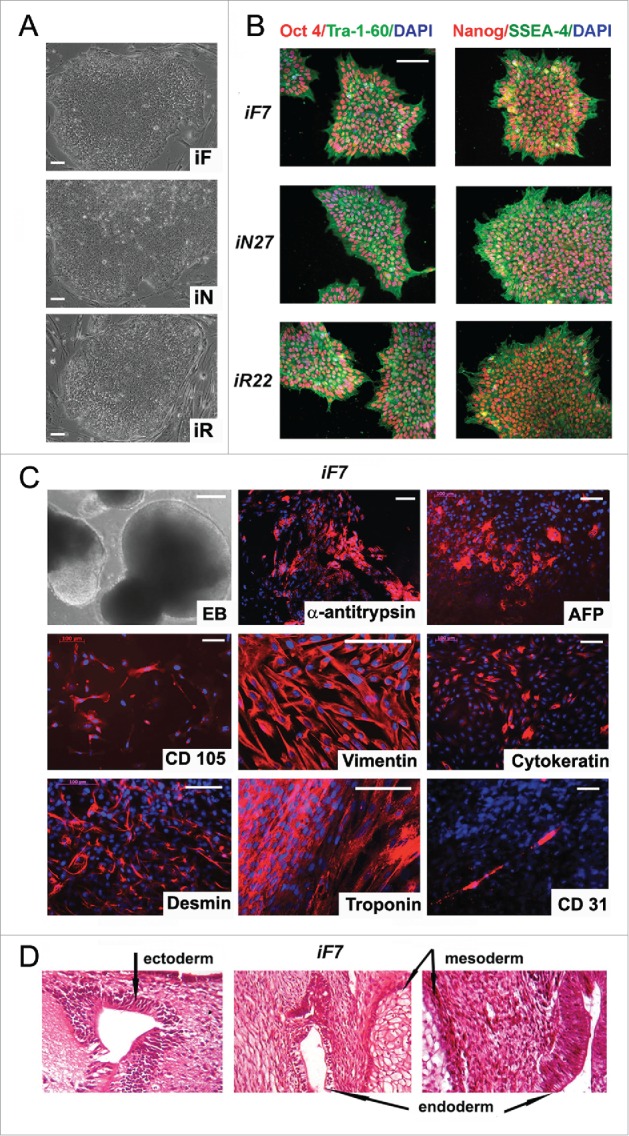
Figure 3.

Characterization of isogenic iPSC lines reprogrammed from fibroblasts, neurons and RPE cells. (A) colony morphology of iF, iN, and iR cells; (B) immunocytochemical assay of iF, iN, and iR cells; for pluripotent markers (red and green indicate respective markers, blue indicates DAPI); (C) representative images of embryoid bodies and immunocytochemistry of in vitro iPSC-derived differentiated cell (red indicates markers, blue indicates DAPI) iF7 clones are shown. Scale bar, 100 mM; (D) Teratoma sections derived from the iF7 cell line, hematoxylin-eosin staining.
