Figure 2.

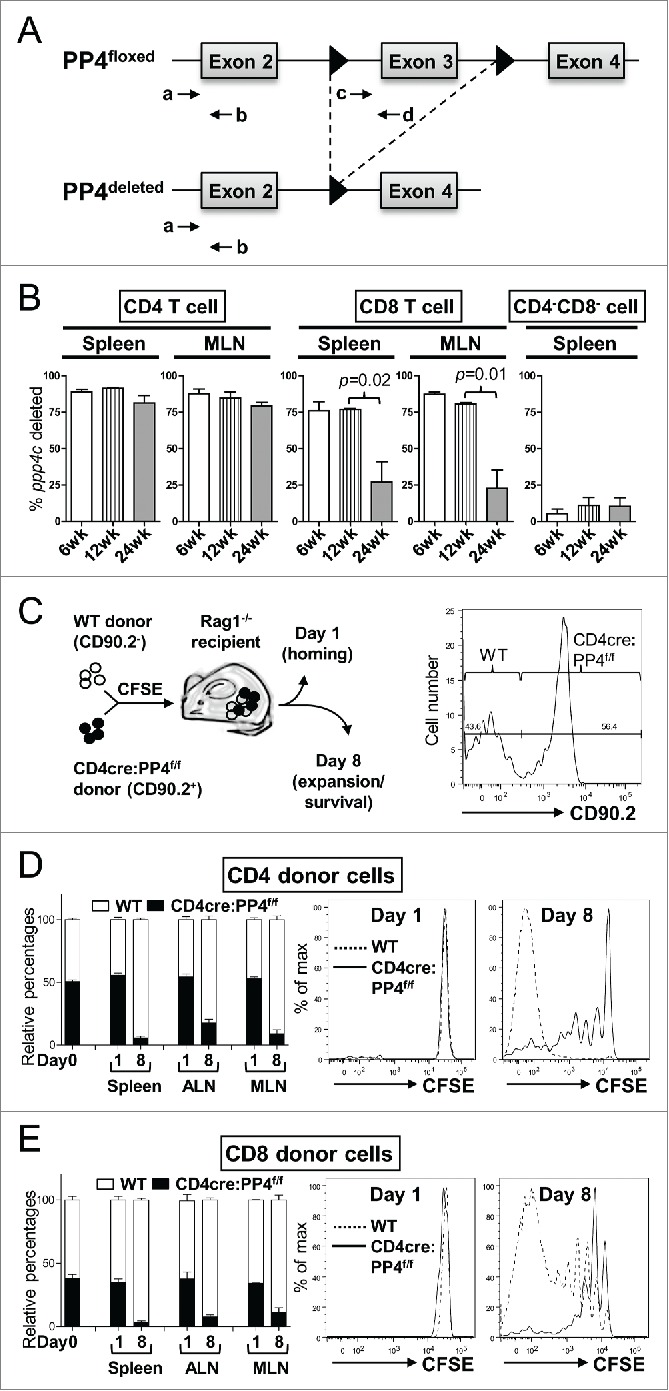
The ablation of PP4 impairs T cell expansion. (A) Schematics of the genomic qPCR assay for quantifying ppp4c deletion efficiency. a-d, PCR primers. Triangle, lox-P sites. (B) CD4, CD8 or control CD4−CD8− splenocytes or MLN cells were sorted by flow cytometry from mice at different ages; DNA extracted from these cells was analyzed by qPCR as in (A) for assessing the deletion efficiency of ppp4c (n = 2–3). (C) Schematics of the homeostatic expansion assay (left panel) and the representative CD90.2 histogram of CD4 splenocytes from the recipient (right panel) are shown. (D-E) WT (CD90.2−) or CD4cre:PP4f/f (CD90.2+) total T cells were purified from pooled spleen and LN by MACS, mixed at a 1:1 ratio (day 0), labeled with CFSE, and transferred into RAG1−/− mice. At day 1 or day 8 post-transfer, spleen, ALN or MLN cells from the recipients were analyzed by flow cytometry for the percentages of WT or CD4cre:PP4f/f donor cells and their respective CFSE dye-dilution patterns. The relative percentages of WT and CD4cre:PP4f/f donor cells (left panels) in gated CD4+ (D) or CD8+ (E) populations are shown. Representative CFSE dye dilution profiles of WT and CD4cre:PP4f/f donor cells are also shown (right panels) (n = 3). See Supplemental Figure S1A–B for flow cytometry gating and sorting strategies.
