Figure 4.

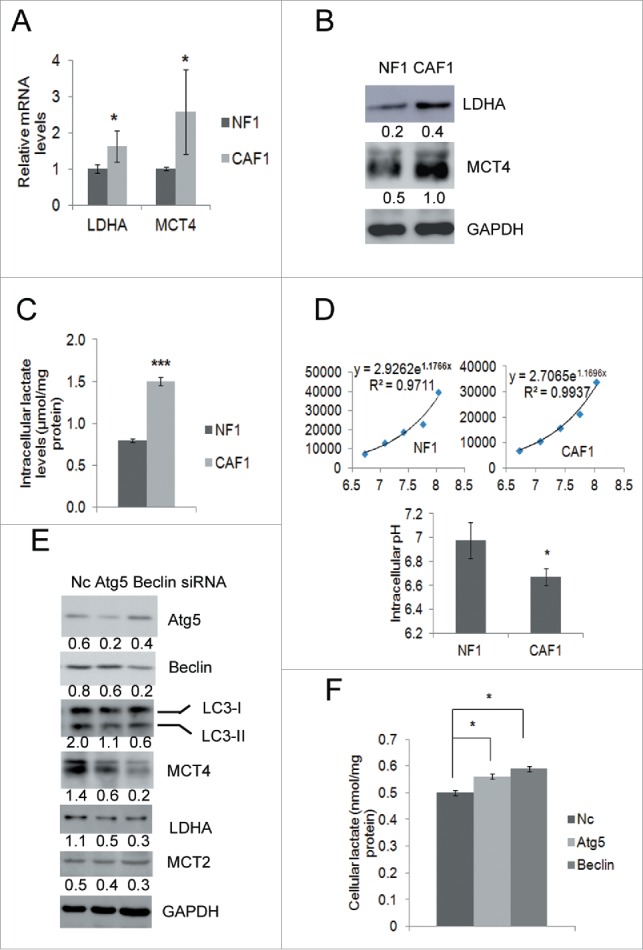
Protein levels of MCT4 and LDHA are downregulated and lactate is accumulated in CAFs when autophagy is inhibited. (A) qRT-PCR analysis of the mRNA levels of LDHA, MCT2 and MCT4 (mean ± SD, n = 3) in NF1 and CAF1 cells. (B) Western blot analysis of the protein levels of LDHA, MCT2 and MCT4 in NF1 and CAF1 cells. The relative intensity of indicated proteins normalized to housekeeping protein was shown at the bottom of each panel. (C) The lactate levels in NF1 and CAF1 cells. Cells cultured in the media without pyruvate for 24 h were lysed and assayed for lactate levels (mean ± SD, n = 3). The lactate levels were normalized to protein concentrations. (D) pHi of NF1 and CAF1 cells. 3 × 10⁴ cells were seeded in 24-well plate overnight, stained with BCECF and lysed with RIPA buffer. The fluorescent signals were read with a fluorometer. The pHi of NF1 and CAF1 cells were calculated by the calibration curves of NF1 and CAF1 cells, respectively (mean ± SD, n = 3). The calibration curves were obtained by permeabilizing cells with nigericin at different pH values. (E) Western blot analysis of the protein levels of MCT4, LDHA and MCT2 in CAF1 cells transfected with the indicated siRNA for 48 h. The relative intensity of indicated proteins normalized to housekeeping protein was shown at the bottom of each panel. (F) The lactate level in CAF1 cells transfected with the indicated siRNA for 48 h (mean ± SD, n = 2). The lactate levels were normalized to protein concentrations. The experiment was repeated twice with similar results.
