Figure 2.
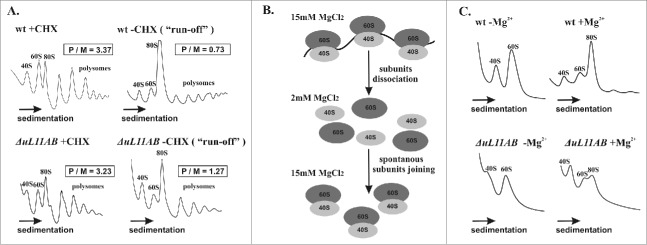
Polysome profile and subunit-joining analysis. (A) the polysome profiles from wild-type and ΔuL11AB yeast cells with (+CHX) and without (−CHX) cycloheximide treatment are shown on the left and right panels, respectively. The polysome to monosome (P/M) ratio was calculated for each profile by dividing the area of the first 3 polysomal peaks by the area of the peak for the 80S monosome. The sedimentation vector of the ribosomal fractions is indicated by an arrow. (B) schematic representation of the ribosomal subunit-joining experiment. (C) ribosomal subunit-joining experiment, upper panel - wild type ribosomes, lower panel - ΔuL11AB mutant strain, -Mg2+, +Mg2+, in the presence of 2 mM and 15 mM MgCl2, respectively.

