Figure 2.

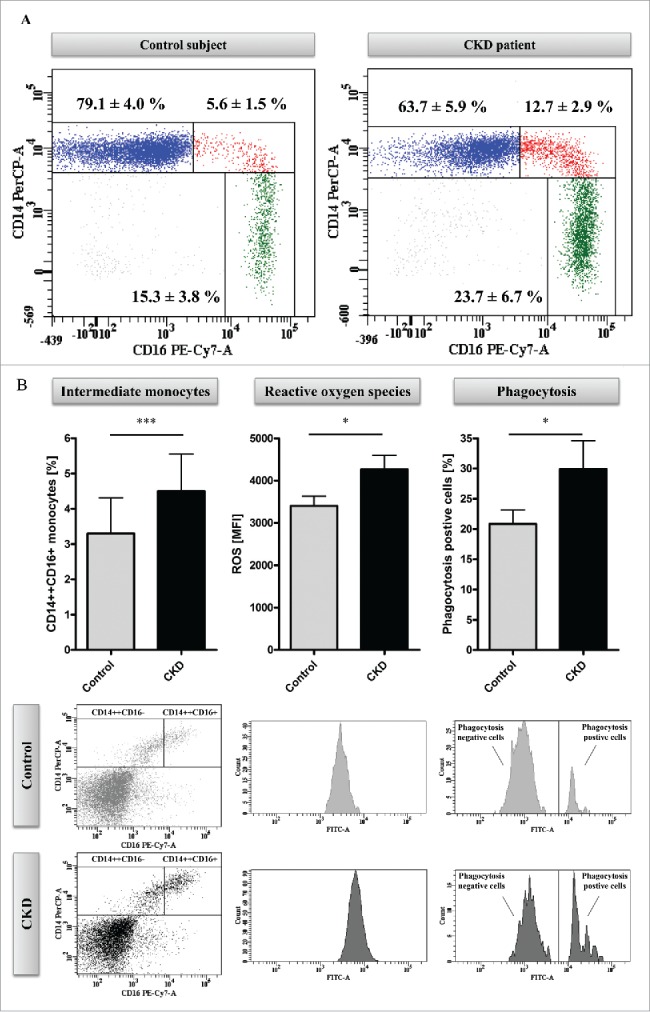
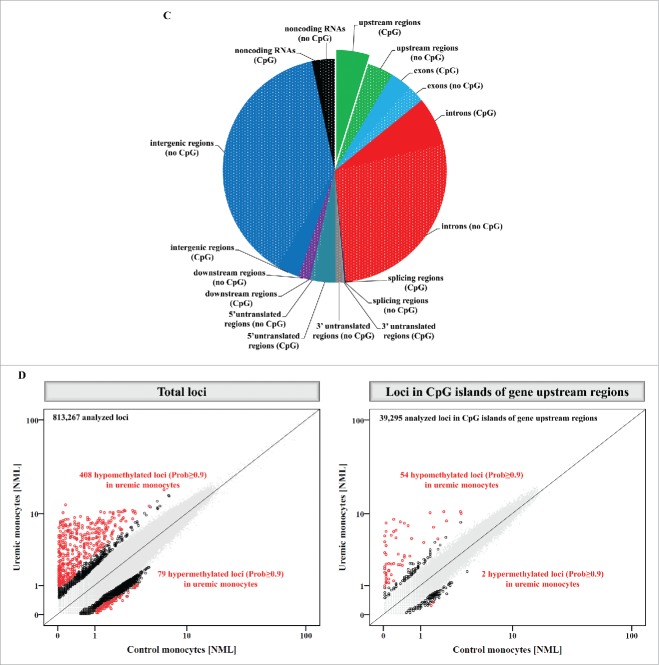
Methyl-Seq analysis of uremic monocytes. (A) Representative dot plots of monocyte subsets of a hemodialysis patient (right panel) and an age and gender matched control subject (left panel). Given are mean percentages (±SD) for monocyte subsets of 5 patients and controls, respectively. (B) Analysis of in vitro differentiated intermediate monocytes. Percentages of intermediate monocytes (left panel) as well as the capacity of intermediate monocytes to produce reactive oxygen species (middle panel) and to phagocyte (right panel) were determined with flow-cytometry. Data are presented as mean±SEM and compared by Student t test. Representative dot plots and histograms are shown. * P<0.05, ***P<0.001. ROS indicates reactive oxygen species. (C) Distribution of mapping regions of Methyl-Seq analysis. Plain sections show analyzed regions in CpG islands, patterned sections show analyzed regions that are not located in CpG islands. CpG islands within gene upstream regions are highlighted, as analyses are focused on these regions throughout the manuscript. (D) Schematic representation of differences in DNA methylation between monocytes that were differentiated under control or under uremic conditions. Presented are total loci (left panel) as well as loci within CpG islands of gene upstream regions (right panel). Loci with differential methylation are given as circles (Prob≥0.9 in red, Prob between 0.8 and 0.9 in black) and all other loci are given as gray dots. To allow better illustration, axes are cut at NML counts of 100, as no differences in DNA methylation were observed in loci with higher NML count. Complete scatter plots are given in Figure S5.
Figure 2.
(Continued)

