
Figure 2.
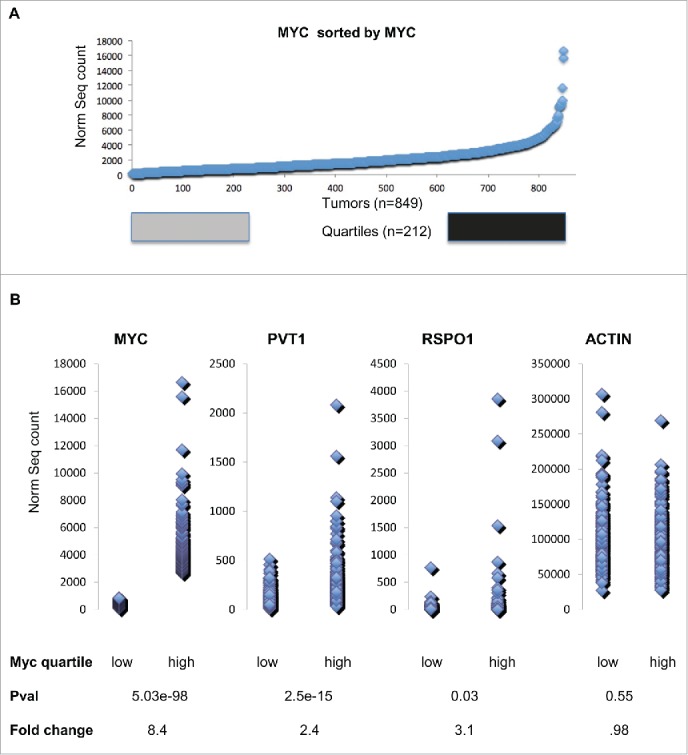
(A) Myc transcript abundance for 849 TCGA Breast cancer tumors sorted by increasing Myc transcript abundance. Tumors within the bottom Quartile are shown in gray and tumors within the top quartile are shown in black. (B) Dot plot comparison of bottom quartile of transcript values compares to top quartile transcript for Myc, Pvt1, Rspo1 and ActB. A two group T-test shows that the Pvt1 and Rspo1 are both significantly higher and show a large average fold change in the top quartile relative to the bottom quartile based on Myc transcript level. ActB is not significantly different by T-test and also by fold change.