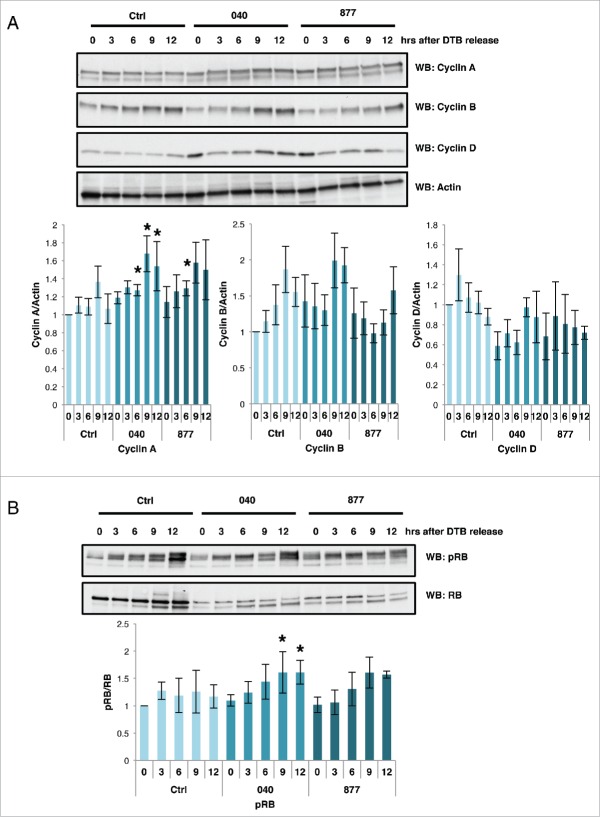
Figure 3.
Cyclin expressions are disrupted in OGA knockdown cells. Control and OGA KD cells were synchronized into G1/S by double thymidine block and released. Time points were harvested every 3 hours for western blot analysis. (A) In the OGA 040 and 877 cells, expression pattern of Cyclin A, B, and D are altered. Expression of actin was used as a load control. (B) phosphorylated RB and are RB protein gel blots were performed as in A. Graphs show normalized densitometric analysis for phosphorylation of RB, or Cyclin(s) A, B, or D protein expression. Signals were first normalized with actin then normalized with control at time-point 0 as indicated (n = 3–4; *, p < 0.05 versus control). Data are expressed as means ± SE. Ctrl = Control, 040 = OGA040, 877 = OGA877. Statistic analysis was performed between Ctrl group and 040 or 877 group at the different time-point accordingly. All experiments were performed with at least 3 biological replicates.

