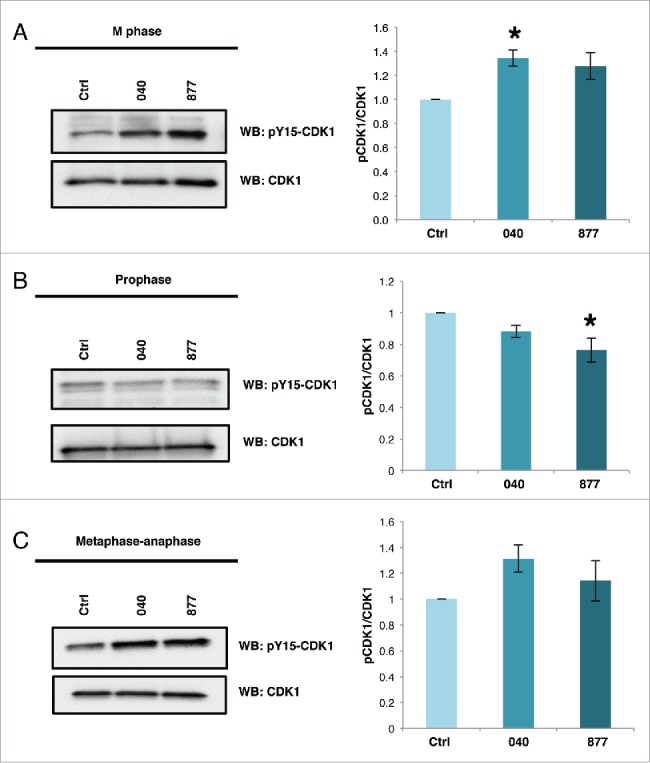
Figure 5.

Inhibitory phosphorylation of tyrosine 15 of CDK1 is higher OGA KD cells. (A-C) Cells were synchronized into M phase by double thymidine block and harvested 9 hours post release (A), overnight treatment with nocodazole to synchronize cells into prophase (B), or treatment 6 post-release from double thymidine block with STC and harvested 14 hours post-release (C), Lysates were probed for phosphorylated Y15 CDK1 and total CDK1. Graphs show densitometry values of phosphorylation of CDK1 in OGA knockdown samples at the different stages of M phase. Signals were normalized first with CDK1 then followed by the control for each sample as indicated (n = 3; *, p < 0.05 vs. control). Data are presented as means ± SE. All experiments were performed with at least 3 biological replicates.
