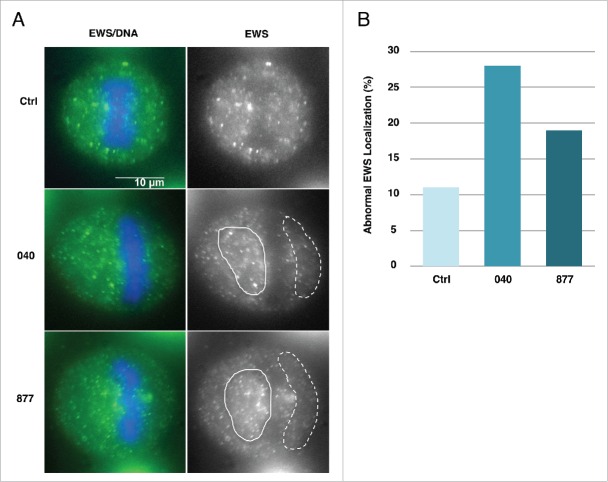
Figure 9.
EWS spindle localization is disrupted in OGA knockdown cells. (A) (Right) EWS visualized with an anti-EWS antibody. Area with clustered EWS signal is shown with white line. Area with sparse EWS signal is shown with dashed while line. (Left) merged images of DNA stained with DAPI (blue) and EWS (green) visualized with an anti-EWS antibody. (B) The percentage of cells with aberrant localization of EWS (n=300 metaphase cells, per sample).

