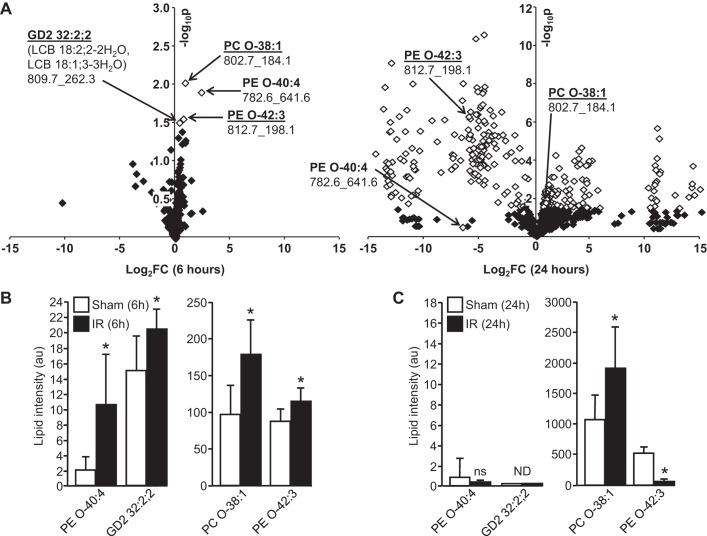
Fig. 2.
Sequential window acquisition of all theoretical spectra (SWATH) mass spectrometry (MS) of renal lipids following IR-induced kidney injury. A: volcano plots showing relative changes (log2 fold-change on x-axis) in renal lipids with intensity values >10 (i.e., 3× signal-to-noise ratio) at 6 (left) and 24 h (right) IR. Fold-changes that are statistically significant are marked as white symbols (>1.301 −log10 P value on y-axis is statistically significant). For each lipid named, numbers below correspond to parent ion mass followed by tandem MS (MS/MS) fragment ion mass used for identification. B: intensities of lipids found to be significantly changed at 6-h IR relative to sham controls. C: intensities of lipids in B at 24 h. See Tables 1–5 for list of all lipid changes at 24 h post-IR. *P < 0.05.

