Fig. 5.
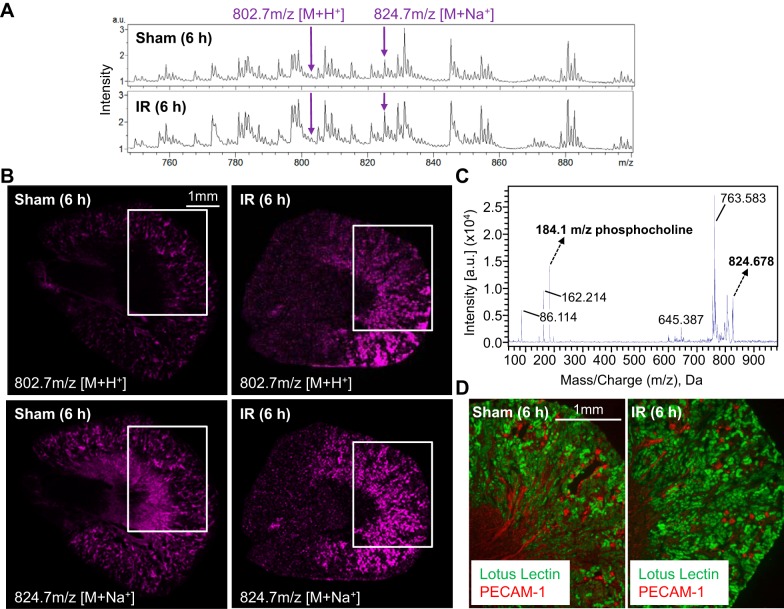
Increases in PC O-38:1 with AKI are predominantly localized to proximal tubules. A: representative matrix-assisted laser desorption ionization-imaging MS (IMS) spectra from 6-h sham control and 6-h IR kidneys. Arrows denote ions at 802.7 and 824.7 m/z consistent with protonated [(M+H+)] PC O-38:1 and sodiated [(M+Na+)] PC O-38:1, respectively. B: positive ion mode MALDI-IMS images of coronal kidney sections from 6-h sham and 6-h IR mice showing the distribution of the minor 802.7-m/z protonated [(M+H+)] PC O-38:1 and the more abundant 824.7-m/z sodiated [(M+Na+)] PC O-38:1. C: positive mode MS/MS analysis of 824.7-m/z (M+Na+) ion showing a 184.1-m/z fragment indicative of the PC headgroup in PC O-38:1 D: Lotus tetragonolobus lectin staining of proximal tubules in coronal kidney sections adjacent to those in A demonstrates that PC O-38:1 is most abundant in proximal tubular areas. White boxes in B mark the areas corresponding to those shown on adjacent sections stained with L. tetragonolobus lectin in D.

