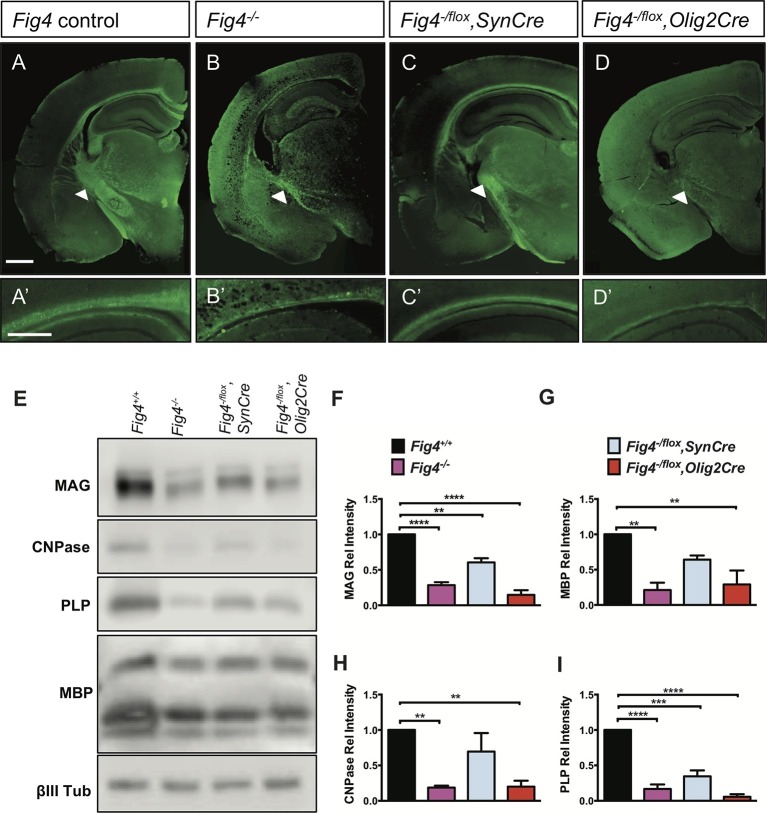
Figure 1. Conditional ablation of Fig4 in neurons or OLs leads to CNS hypomyelination.
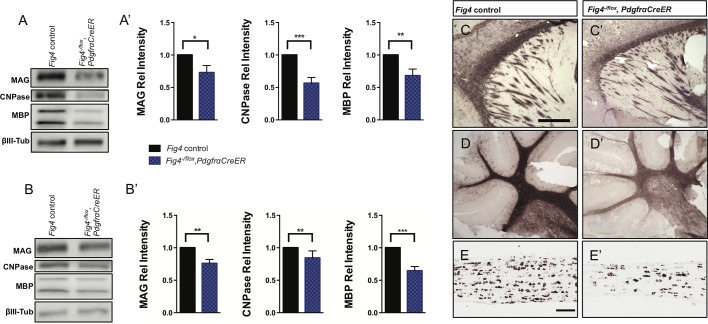
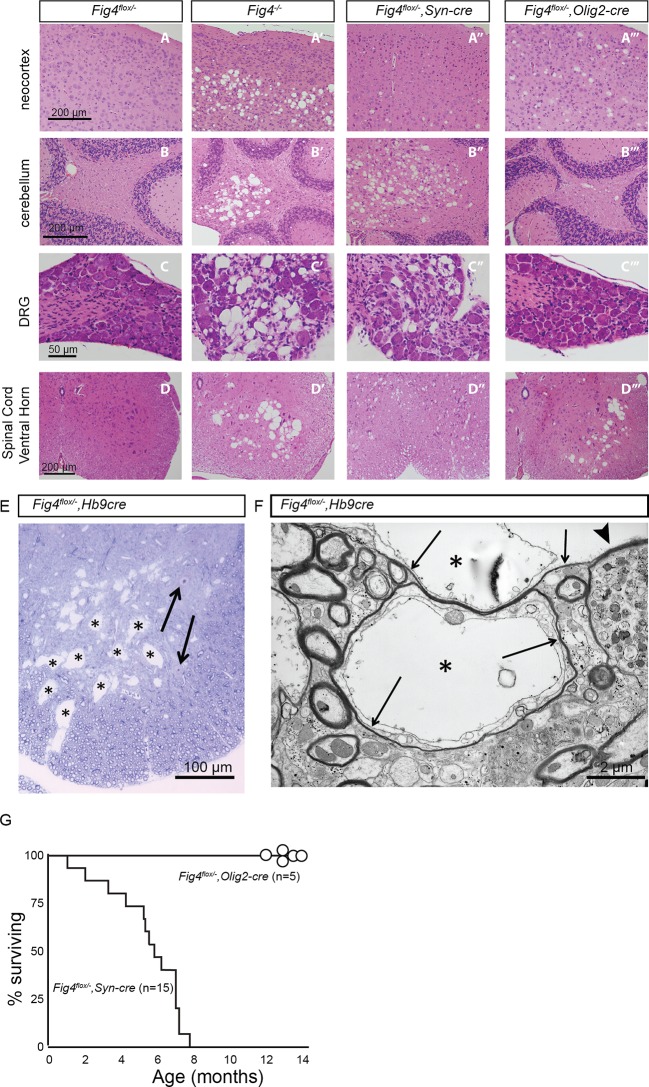
(A-D) Coronal sections of juvenile (P21-30) mouse forebrain stained with FluoroMyelin Green. (A) Fig4 control mice (harboring at least one Fig4 WT allele), (B) Fig4 germline null mice (Fig4-/-), (C) Fig4-/flox,SynCre mice and (D) Fig4-flox,Olig2Cre mice. Thinning of the corpus callosum and internal capsule (white arrowheads) is observed in Fig4-/-, Fig4-/flox,SynCre, and Fig4-flox,Olig2Cre mice. (A’-D’) Higher magnification images of the corpus callosum. Scale bar (A-D), 1 mm and (A’-D’), 400 µm. (E) Representative Western blots of P21 brain membranes prepared from Fig4+/+(WT), Fig4-/-, Fig4-/flox,SynCre and Fig4-/flox,Olig2Cre mice probed with antibodies specific for the myelin proteins MAG, CNPase, PLP, and MBP. To control for protein loading, membranes were probed for the neuronal marker class III β-tubulin (βIII Tub). (F-I) Quantification of Western blot signals for MAG, MBP, CNPase, and PLP in Fig4+/+ (black bars), Fig4-/- (purple bars), Fig4-/flox,SynCre (light blue bars), and Fig4-flox,Olig2Cre (red bars) brain membranes. Quantification of myelin protein signals is normalized to βIII Tub. Relative protein intensities compared to WT brain are shown as mean value ± SEM. For each of the four genotypes, three independent membrane preparations were carried out. One-way ANOVA with multiple comparisons, Dunnett posthoc test; **p<0.01, ***p<0.001 and ****p<0.0001. An independent strategy for OL-specific Fig4 deletion results in a similar phenotype as shown in Figure 1—figure supplement 1. Histochemical staining of brain, spinal cord and dorsal root ganglion tissue sections of Fig4 conditional knock-out mice, as well as Kaplan-Meier plots for Fig4-/flox,SynCre and Fig4-flox,Olig2Cre mice are shown in Figure 1—figure supplement 2.


