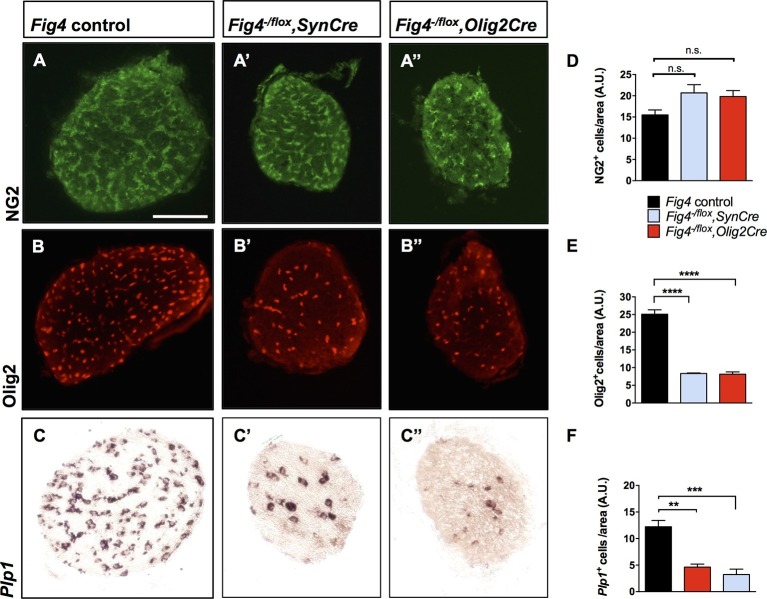
Figure 4. Conditional ablation of Fig4 in neurons or OLs results in a decrease of mature OLs.
(A, B, C) Optic nerve cross sections from P21 Fig4 control mice, harboring at least one Fig4 WT allele, (A’, B’, C’) Fig4-/flox,SynCre mice and (A’’, B’’, C’’) Fig4-/flox,Olig2Cre mice were stained with anti-NG2, anti-Olig2 or probed for Plp1 mRNA expression. Scale bar = 100 µm. (D-F) Quantification of labeled cells in optic nerve cross sections normalized to area in arbitrary units (A.U.). (D) The density of NG2+ cells in Fig4 control (n = 4 mice), Fig4-/flox,SynCre (n = 3 mice) and Fig4-/flox,Olig2Cre (n = 3 mice) optic nerves is not significantly (n.s.) different. (E) Quantification of the density of Olig2+ cells in Fig4 control (n = 6 mice), Fig4-/flox,SynCre (n = 3 mice) and Fig4-/flox,Olig2Cre (n = 4 mice) optic nerves. (F) Quantification of the density of Plp1+ cells in Fig4 control (n = 8 mice), Fig4-/flox,SynCre (n = 4 mice) and Fig4-/flox,Olig2Cre (n = 4 mice) optic nerves. Results are shown as mean value ± SEM, one-way ANOVA with multiple comparisons, Dunnett’s posthoc test. **p=0.001, ***p=0.0002 and ****p<0.0001.

