. 2016 Mar 23;5:e13023. doi: 10.7554/eLife.13023

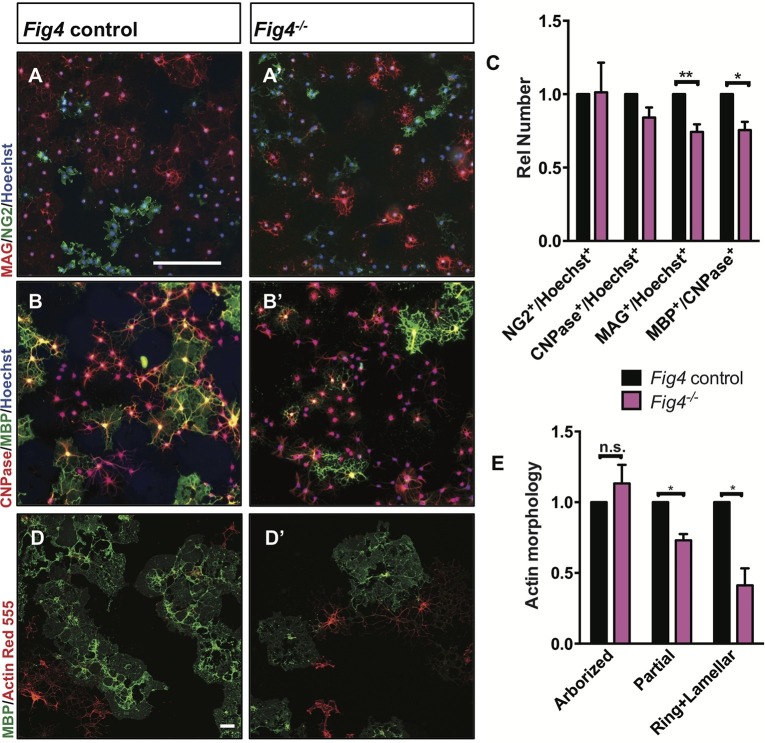
Figure 5. Fig4-deficient OLs show impaired differentiation and membrane expansion in vitro.

Representative images of Fig4 control (Fig4+/+ or Fig4+/-) and Fig4-/- primary OLs after 4 days in differentiation medium, fixed and stained for the OL-lineage markers (and A’) NG2 and MAG; (and B’) CNPase and MBP. Scale bar in A-B’, 200 µm. (C) Quantification of NG2, CNPase, MAG, and MBP/CNPase labeled cells in Fig4 control (n = 3) and Fig4-/-(n = 3) cultures normalized to Hoechst 33342 dye labeled cells. The ratio of immunolabeled cells over Hoechst+ cells in Fig4 control cultures was set at 1. Results are shown as mean value ± SEM, multiple t-test analysis with Holm-Sidak method. **p=0.0075 (MAG), *p=0.012 (MBP). (D and D’) Confocal images of MBP+ and Actin Red 555+ OLs in Fig4 control and Fig4-/- cultures. Nuclei were labeled with TO-PRO-3, scale bar = 20 µm. (E) Quantification of the fraction of “arborized” (actin rich, no MBP), “partial” (partial actin disassembly, onset of MBP expansion), and “ring + lamellar” (full MBP expansion, actin disassembly) in Fig4 control cultures (n = 4) and Fig4-/- (n = 4) cultures. Results are shown as mean value ± SEM, multiple t-test analysis with Holm-Sidak method. *p=0.0008 (“partial”), *p=0.009 (“ring + lamellar”). The effects of Fig4 deletion on OPC proliferation and OL survival are shown in Figure 5—figure supplement 1. Quantitative Western blot analysis of myelin proteins in primary OL lysates is shown in Figure 5—figure supplement 2.

DOI: http://dx.doi.org/10.7554/eLife.13023.011

Figure 5.

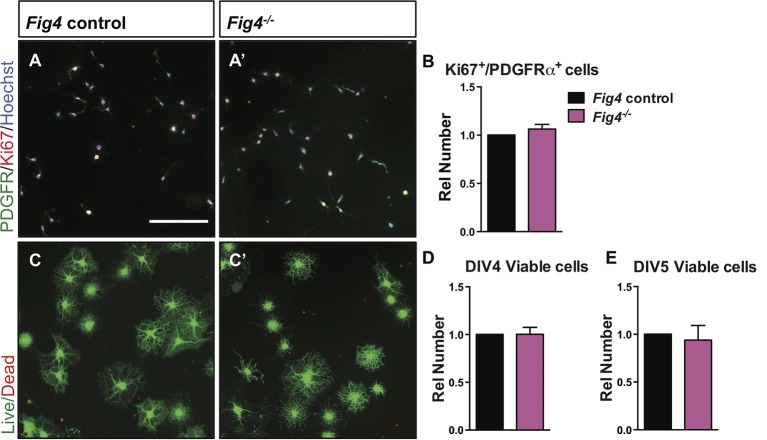
Figure 5—figure supplement 1. Loss of Fig4-/- in primary OLs does not affect cell proliferation or cell death.

Figure 5—figure supplement 1.

(A-A’) Representative images of control (Fig4+/+ or Fig4+/-) and Fig4-/- OPCs cultured for 2 days under proliferative conditions, fixed and stained with anti-PDGFRα (green) and Ki67 (red). Hoechst 33342 dye was included for nuclear staining of all cells. Scale bar = 200 µm. (B) Quantification of PDGFRα and Ki67 double-labeled cells. The number of double stained cells in Fig4 control cultures was set at 1 and is comparable to Fig4-/- cultures (n = 4 experiments per genotype). Results are shown as mean value ± SEM, unpaired Student’s t-test. (C-C’) Representative images of OLs after 4 days in T3 containing differentiation medium. Cultures were fixed and stained with calcein-AM (green, living cells) and ethidium homodimer (red, dead cells). Scale bar = 200 µm. Quantification of live cells after 4 days (D) and 5 days (E) in differentiation medium revealed no differences among the two genotypes. Fig4control cultures (n = 4) and Fig4-/- cultures (n = 4). Results are shown as mean value ± SEM, unpaired Students t-test.
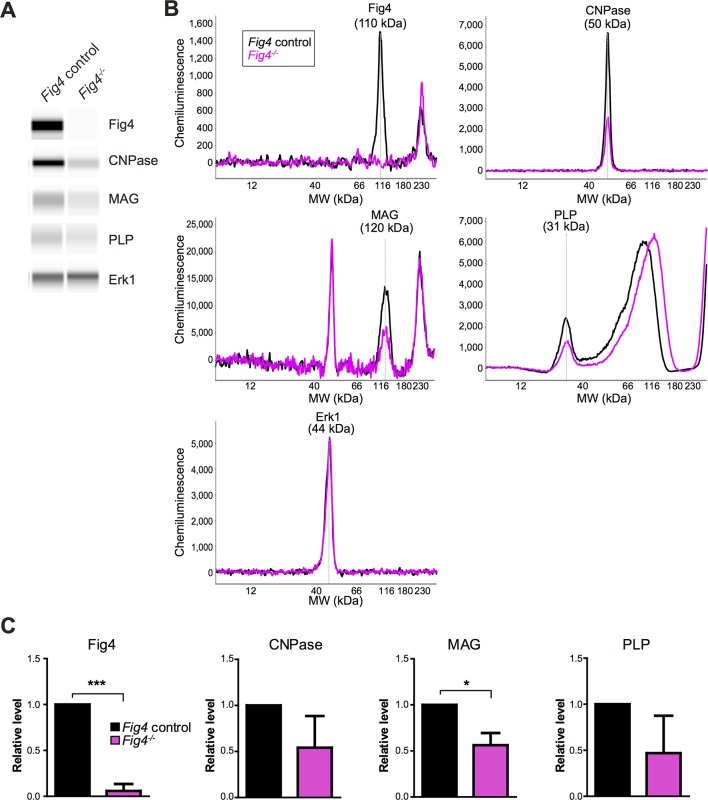
Figure 5—figure supplement 2. Capillary Western analysis of primary OL lysates.

Figure 5—figure supplement 2.

(A) Representative capillary immunoassay data of Fig4 control and Fig4-/- OPC/OLs are shown in Simple Western lane view. (B) Representative chemiluminescence signal intensity graphs and protein molecular weight of individual proteins. Fig4 control and Fig4-/- OPC/OLs lysates are shown as black and pink lines respectively. Specific peaks corresponding to each protein target are marked. (C) Quantification of protein of Erk1-normalized peak area of each protein target. Three independent experiments were used for quantification. Results are shown as mean value ± SD. *p<0.05; ***p<0.005.