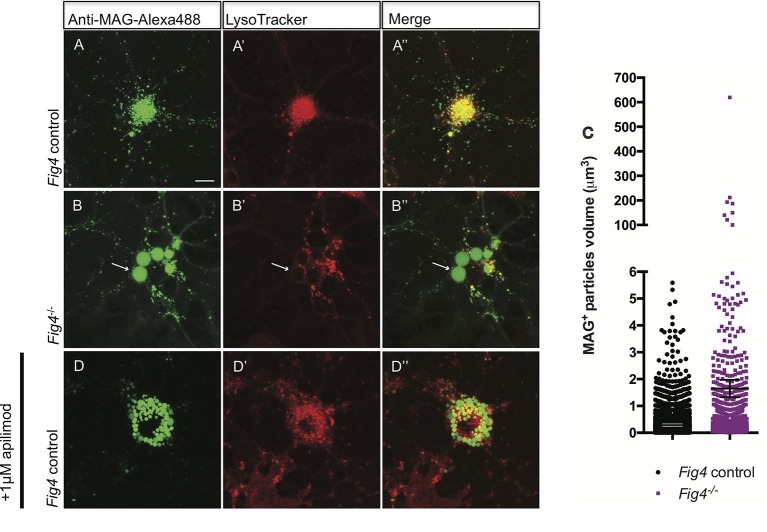
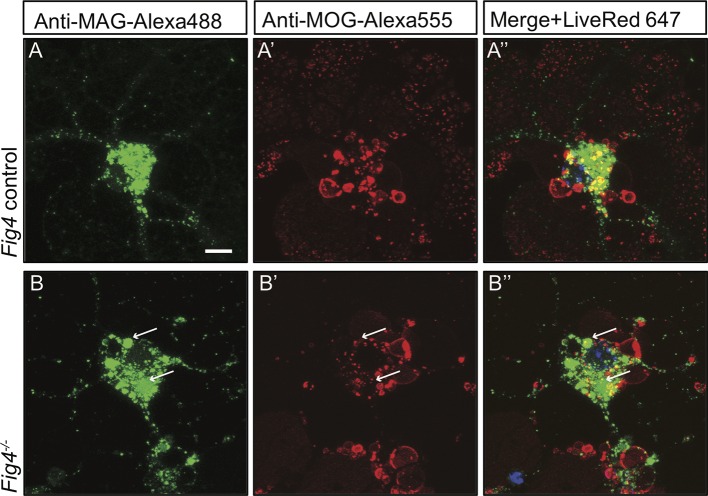
Figure 8. In Fig4-/- OLs, MAG accumulates in large perinuclear vacuoles.
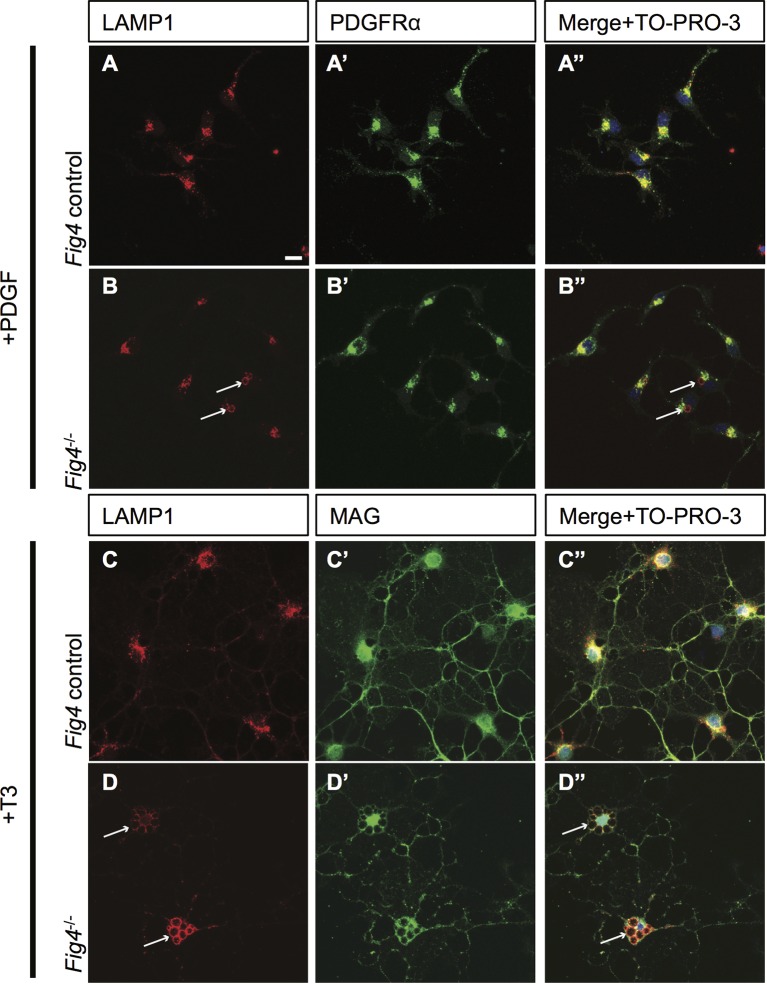
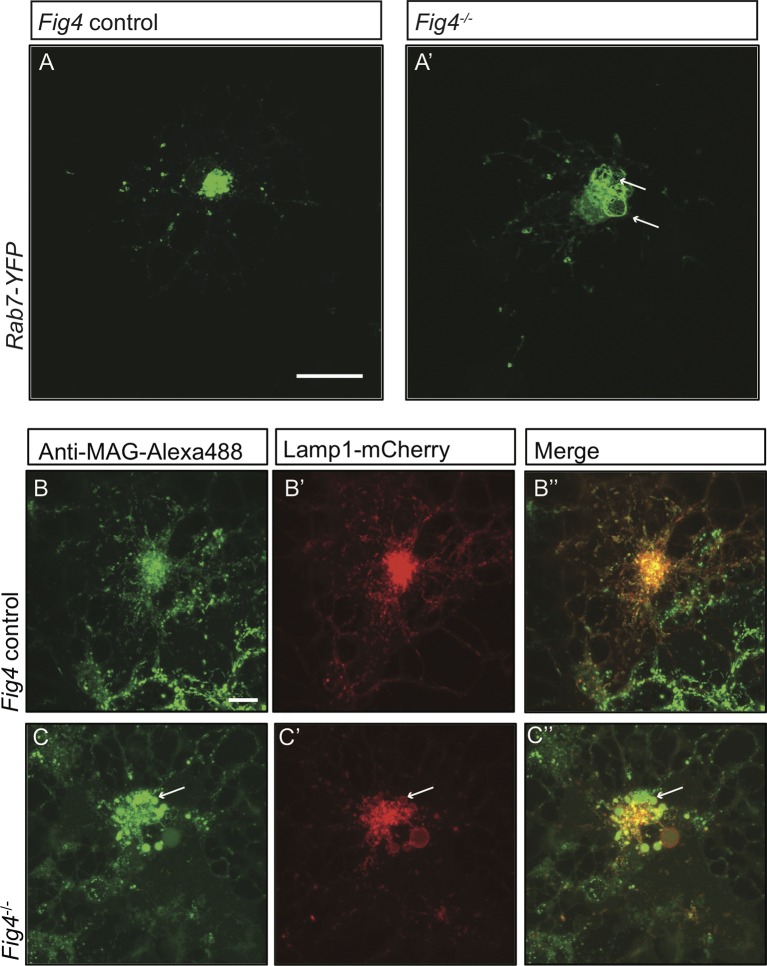
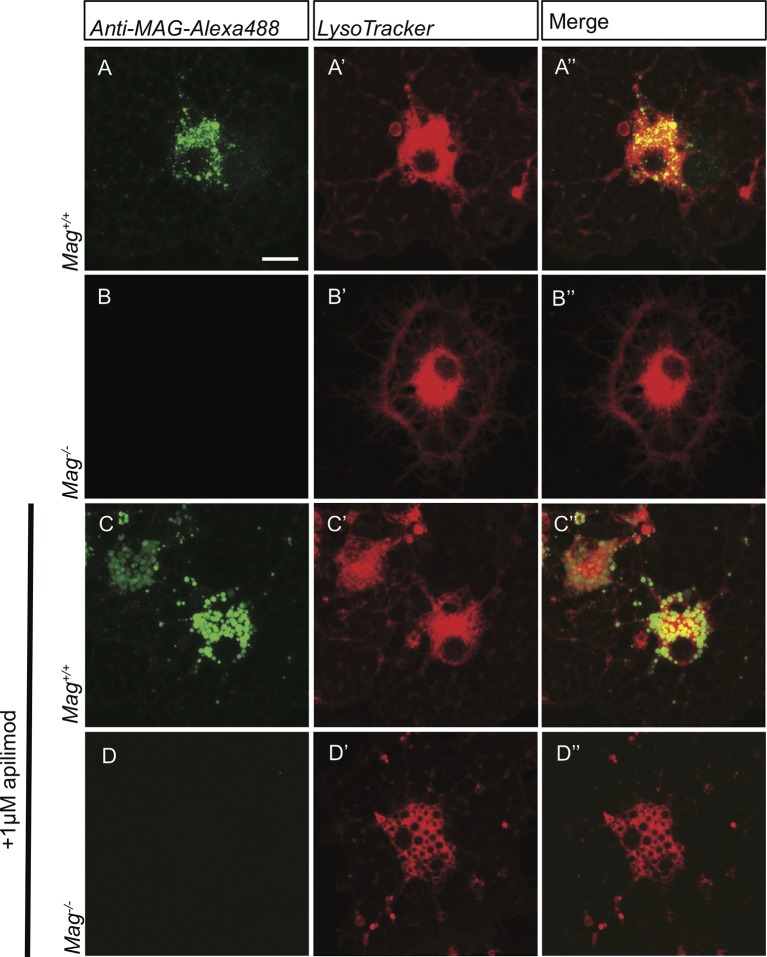
Confocal images of live OLs acutely labeled with bath applied anti-MAG-Alexa488 (green) and LysoTracker Deep Red. (A-A’’) Fig4 control (Fig4+/+ or Fig4+/-) OLs incubated with anti-MAG-Alexa488 and LysoTracker, single channel and merged images are shown. (B-B”) Fig4-/- OLs incubated with anti-MAG-Alexa488 and Lysotracker shows accumulation of MAG in large perinuclear vacuoles (arrows), single channel and merged images are shown. Of note, large perinucler MAG+ vacuoles do not stain with LysoTracker. (C) Scatter plot depicting the volume of anti-MAG-Alexa488+ particles in live Fig4 control and Fig4-/- OLs. Each dot represents an individual vesicle (n = 4 experiments, 9 cells per genotype). Mean volumes ± SEM are shown. (D-D”) Wildtype OLs were incubated with anti-MAG-Alexa488 and LysoTracker and then acutely treated with the PIKfyve inhibitor apilimod. MAG accumulates in large perinuclear vacuoles, the majority of which does not stain with LysoTracker (n = 4 for Fig4 controls and n = 4 for Fig4-/-cultures). For apilimod treatment, n = 3 independent cultures. Maximum projection confocal z-stack images are shown, scale bar = 10 μm. Further characterization of enlarged perinuclear vacuoles in Fig4-/- OL cultures, specificity control for the anti-MAG-Alexa488 antibody and distinct trafficking routes of MAG and MOG are shown in Figure 8—figure supplement 1–3 and 4.

