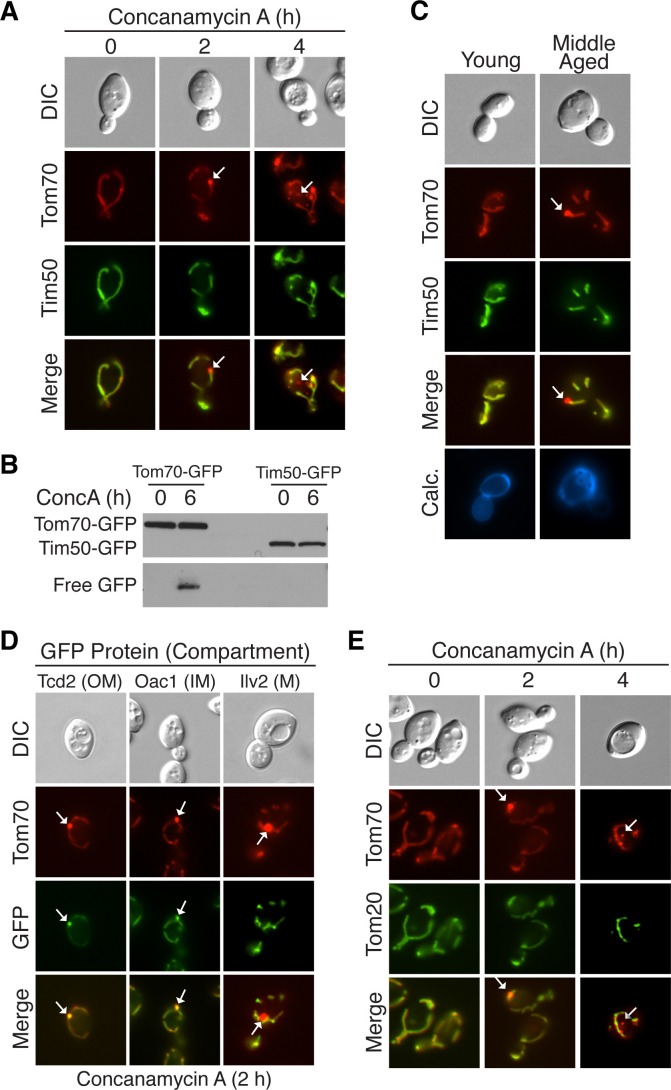
Figure 5. Select mitochondrial proteins are incorporated into MDCs.
(A) The inner mitochondrial membrane protein Tim50 is excluded from MDC-dependent degradation. Wild-type cells expressing Tom70-mCherry and Tim50-GFP were treated with concanamycin A for the indicated time and representative images showing Tim50 exclusion from the MDC (2 hr, white arrow) and vacuole (4 hr, white arrow) are shown. 100% of cells show this phenotype of Tim50 exclusion. N = 50. (B) Tom70-GFP and Tim50-GFP were monitored for autophagy-dependent degradation using a GFP-cleavage assay in wild-type (WT) cells expressing either Tom70-GFP or Tim50-GFP treated with concanamycin A (ConcA) for the indicated time (hr). Whole-cell extracts from the treated cells were subjected to immunoblot analysis with anti-GFP antibody. As in Figure 2D, the use of conc A as an inducer limited the amount of GFP cleavage in the vacuole. Consequently, the exposure time of the free GFP immunoblot is ~20 times longer than the exposure of the immunoblot with full-length GFP-tagged proteins. (C) Tim50 is excluded from MDCs in middle-aged cells. Wild-type cells expressing Tom70-mCherry and Tim50-GFP were aged and representative images showing Tim50 exclusion from the MDC (white arrow) are shown. 100% of cells show this phenotype of Tim50 exclusion. N = 30. (D) Mitochondrial outer membrane proteins and inner membrane carrier proteins localize to MDCs. Wild-type cells expressing Tom70-mCherry and the indicated C-terminal GFP fusion proteins were treated with concanamycin A for 2 hr and protein inclusion in MDCs (white arrows) was assessed. GFP-tagged marker proteins represent mitochondrial outer membrane (OM), inner membrane carrier proteins (IM), and matrix proteins (M). 100% of cells show the phenotypes in the representative images. N = 50. (E) Tom20 is excluded from MDCs. Wild-type cells expressing Tom70-mCherry and Tom20-GFP were treated with concanamycin A for the indicated time and representative images showing Tom20 exclusion from the MDC (2 hr, white arrow) and vacuole (4 hr, white arrow) are shown. 100% of cells show this phenotype of Tom20 exclusion. N = 50.


