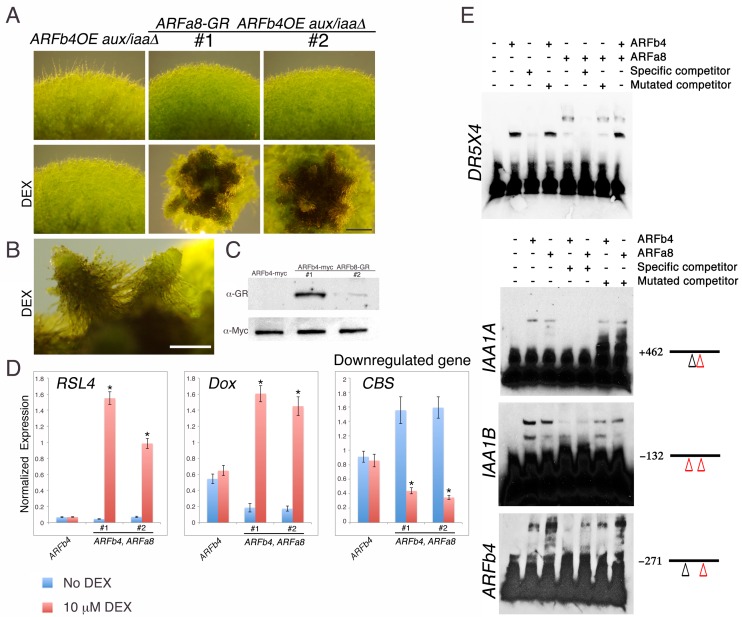
Figure 4. Repressing and activating ARFs display opposite effects on the same target genes.
(A) ARFb4OE_aux/iaaΔ (line #1 in Figure 3A), and two ARFa8-GR ARFb4OE_aux/iaaΔ lines grown on BCDAT or BCDAT supplemented with 10 μM DEX for a month. Scale bar: 0.5 mm. (B) Enlargement of gametophores of line #1. Scale bar: 0.5 mm. (C) Immunoblot of total protein extracts from plants shown in E, detected with GR and c-Myc antibodies. (D) qPCR showing the expression levels of auxin responsive genes in the transgenic lines shown in A, ARFb4OE_aux/iaaΔ (ARFb4) and ARFa8-GR ARFb4OE_aux/iaaΔ (ARFb4, ARFa8) mock- or 10 μM DEX-treated for overnight. Error bars represent s.e.m. *p<0.05 (t-test comparing DEX-induced- to uninduced gene expression levels in ARFb4, ARFa8 lines), n=3. (E) Electrophoretic mobility shift assay with GST-ARFb4 DBD and GST-ARFa8 DBD (ARFb4, ARFa8) with biotin-labeled DNA probes from DR5, IAA1A, IAA1B, and ARFb4 promoters. + and – signs denote the presence or the absence of ARF proteins, and unlabeled specific or mutant competitor DNA sequences. Black line and numbers represent the probe locations respectively to the gene transcription start sites. Red triangles: canonical TGTCTC AuxREs. Black triangles: core TGTC AuxREs.

