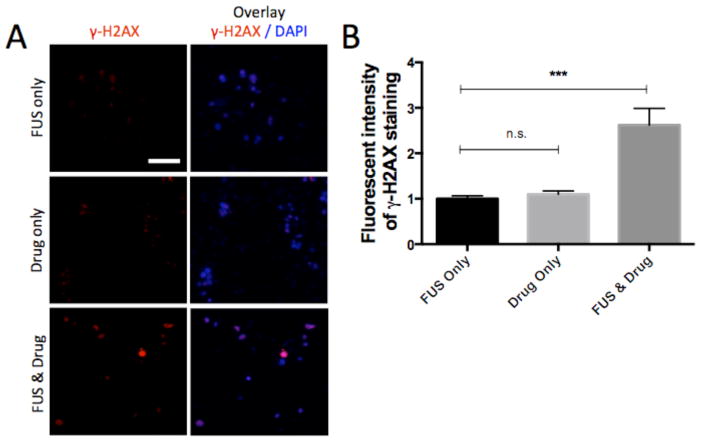
Figure 4.
Analysis of DNA damage in response to drug exposure in the device. (A) Immunostaining of γ-H2AX and DAPI in the microfluidic device under conditions of FUS-exposure, no-drug release (0.3μM doxorubicin-TS-liposomes) and FUS-triggered drug release (FUS & drug: 0.3μM). Each image corresponds to a single confocal slice. Scale bar corresponds to 100μm. (B) Quantification of staining intensity per cell in (A). Average values (n=40), and error bars represent standard deviation. Values normalized to the γ-H2AX intensity for the FUS only condition. Statistically significant differences are highlighted (*** p<0.001).

