
Fig. 2.
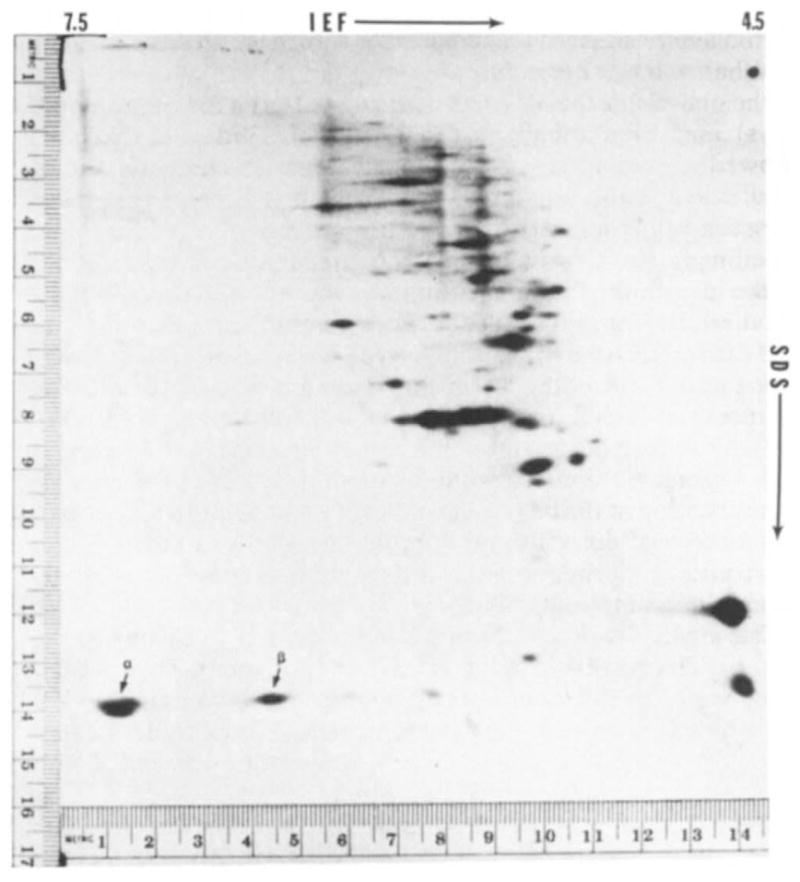
Fluorograph of two-dimensional electrophoretic separation of proteins from 20 one-cell fertilised mouse ova injected with mouse globin mRNA and incubated in 3H-labelled amino acids. Isoelectric focusing (IEF) was from left (pH 7.5) to right (pH 4.5) and SDS-polyacrylamide electrophoresis was from top to bottom. The technique used was basically that of O’Farrell, as previously described12,16. The IEF was carried out with pH 3–10 ampholines. Marker proteins on the right margin are lactoglobulin (top, MW = 18,400) and methaemoglobin (bottom, MW= 16,000). The two radioactive spots indicated by the arrows coincide with the position of the non-radioactive globin marker protein prepared from mouse blood. α and β indicate the positions of α- and β-chains of globin.