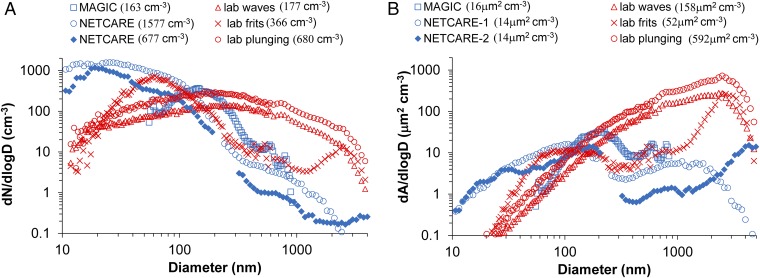
Fig. 4.
Size distributions of concentrations of (A) aerosol number and (B) surface area for three laboratory particle generation methods (in red) (38, 39, 44), compared with ambient aerosol size distributions (in blue) measured by the ultrahigh-sensitivity aerosol spectrometer instrument during the open ocean IS filter sampling period east of Hawaii during the MAGIC study and two sampling periods during the 2014 NETCARE program. Total integrated particle number and surface area for each distribution is shown in parentheses in the legend.

